Immigrants from Russia vs Dutch West Indian 3 or more Vehicles in Household
COMPARE
Immigrants from Russia
Dutch West Indian
3 or more Vehicles in Household
3 or more Vehicles in Household Comparison
Immigrants from Russia
Dutch West Indians
16.9%
3 OR MORE VEHICLES IN HOUSEHOLD
0.1/ 100
METRIC RATING
295th/ 347
METRIC RANK
20.9%
3 OR MORE VEHICLES IN HOUSEHOLD
97.8/ 100
METRIC RATING
103rd/ 347
METRIC RANK
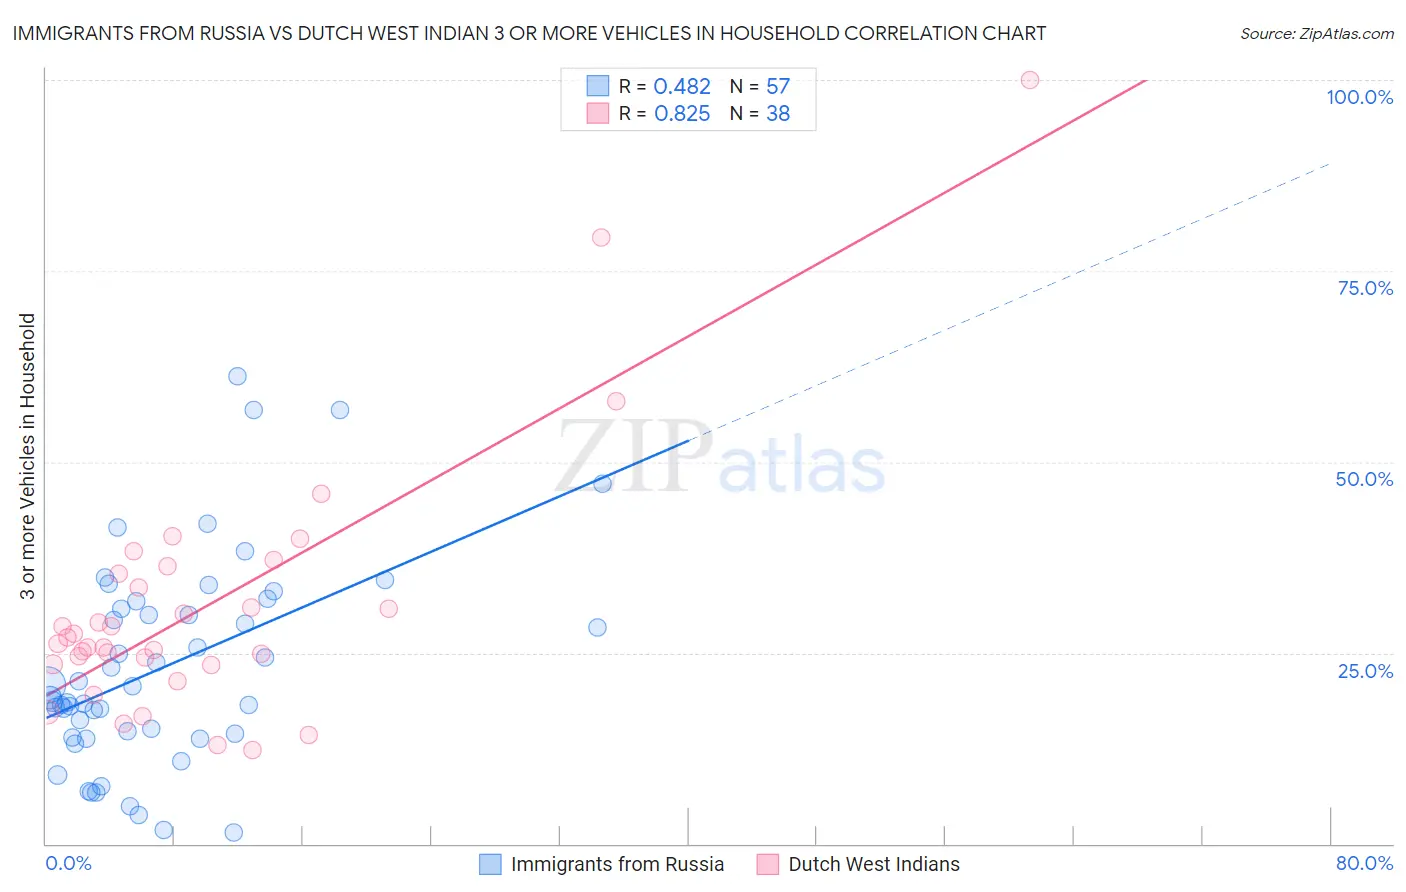
Immigrants from Russia vs Dutch West Indian 3 or more Vehicles in Household Correlation Chart
The statistical analysis conducted on geographies consisting of 347,621,563 people shows a moderate positive correlation between the proportion of Immigrants from Russia and percentage of households with 3 or more vehicles available in the United States with a correlation coefficient (R) of 0.482 and weighted average of 16.9%. Similarly, the statistical analysis conducted on geographies consisting of 85,766,140 people shows a very strong positive correlation between the proportion of Dutch West Indians and percentage of households with 3 or more vehicles available in the United States with a correlation coefficient (R) of 0.825 and weighted average of 20.9%, a difference of 23.5%.
3 or more Vehicles in Household Correlation Summary
| Measurement | Immigrants from Russia | Dutch West Indian |
| Minimum | 1.4% | 12.2% |
| Maximum | 61.1% | 100.0% |
| Range | 59.7% | 87.8% |
| Mean | 23.0% | 31.1% |
| Median | 19.1% | 26.6% |
| Interquartile 25% (IQ1) | 14.1% | 23.5% |
| Interquartile 75% (IQ3) | 31.2% | 35.3% |
| Interquartile Range (IQR) | 17.1% | 11.8% |
| Standard Deviation (Sample) | 13.5% | 16.9% |
| Standard Deviation (Population) | 13.3% | 16.7% |
Similar Demographics by 3 or more Vehicles in Household
Demographics Similar to Immigrants from Russia by 3 or more Vehicles in Household
In terms of 3 or more vehicles in household, the demographic groups most similar to Immigrants from Russia are Immigrants from Western Africa (16.9%, a difference of 0.050%), Bahamian (16.9%, a difference of 0.16%), Immigrants from Spain (17.0%, a difference of 0.25%), Immigrants from Congo (17.0%, a difference of 0.36%), and Inupiat (16.9%, a difference of 0.36%).
| Demographics | Rating | Rank | 3 or more Vehicles in Household |
| Immigrants | Uruguay | 0.2 /100 | #288 | Tragic 17.1% |
| Immigrants | Liberia | 0.1 /100 | #289 | Tragic 17.1% |
| Liberians | 0.1 /100 | #290 | Tragic 17.0% |
| Immigrants | Congo | 0.1 /100 | #291 | Tragic 17.0% |
| Immigrants | Spain | 0.1 /100 | #292 | Tragic 17.0% |
| Bahamians | 0.1 /100 | #293 | Tragic 16.9% |
| Immigrants | Western Africa | 0.1 /100 | #294 | Tragic 16.9% |
| Immigrants | Russia | 0.1 /100 | #295 | Tragic 16.9% |
| Inupiat | 0.1 /100 | #296 | Tragic 16.9% |
| Israelis | 0.1 /100 | #297 | Tragic 16.8% |
| Immigrants | Zaire | 0.1 /100 | #298 | Tragic 16.7% |
| Immigrants | South America | 0.1 /100 | #299 | Tragic 16.7% |
| Cypriots | 0.0 /100 | #300 | Tragic 16.6% |
| Paraguayans | 0.0 /100 | #301 | Tragic 16.6% |
| Immigrants | Greece | 0.0 /100 | #302 | Tragic 16.5% |
Demographics Similar to Dutch West Indians by 3 or more Vehicles in Household
In terms of 3 or more vehicles in household, the demographic groups most similar to Dutch West Indians are Seminole (20.9%, a difference of 0.040%), Blackfeet (20.9%, a difference of 0.070%), Luxembourger (20.9%, a difference of 0.080%), Austrian (20.9%, a difference of 0.19%), and Bolivian (20.8%, a difference of 0.28%).
| Demographics | Rating | Rank | 3 or more Vehicles in Household |
| Cree | 98.4 /100 | #96 | Exceptional 21.0% |
| Canadians | 98.3 /100 | #97 | Exceptional 21.0% |
| Hmong | 98.2 /100 | #98 | Exceptional 21.0% |
| Alaska Natives | 98.2 /100 | #99 | Exceptional 21.0% |
| Comanche | 98.2 /100 | #100 | Exceptional 21.0% |
| Blackfeet | 97.9 /100 | #101 | Exceptional 20.9% |
| Seminole | 97.8 /100 | #102 | Exceptional 20.9% |
| Dutch West Indians | 97.8 /100 | #103 | Exceptional 20.9% |
| Luxembourgers | 97.7 /100 | #104 | Exceptional 20.9% |
| Austrians | 97.5 /100 | #105 | Exceptional 20.9% |
| Bolivians | 97.4 /100 | #106 | Exceptional 20.8% |
| Immigrants | Germany | 97.4 /100 | #107 | Exceptional 20.8% |
| Immigrants | Scotland | 97.1 /100 | #108 | Exceptional 20.8% |
| Filipinos | 97.0 /100 | #109 | Exceptional 20.8% |
| Asians | 96.8 /100 | #110 | Exceptional 20.8% |