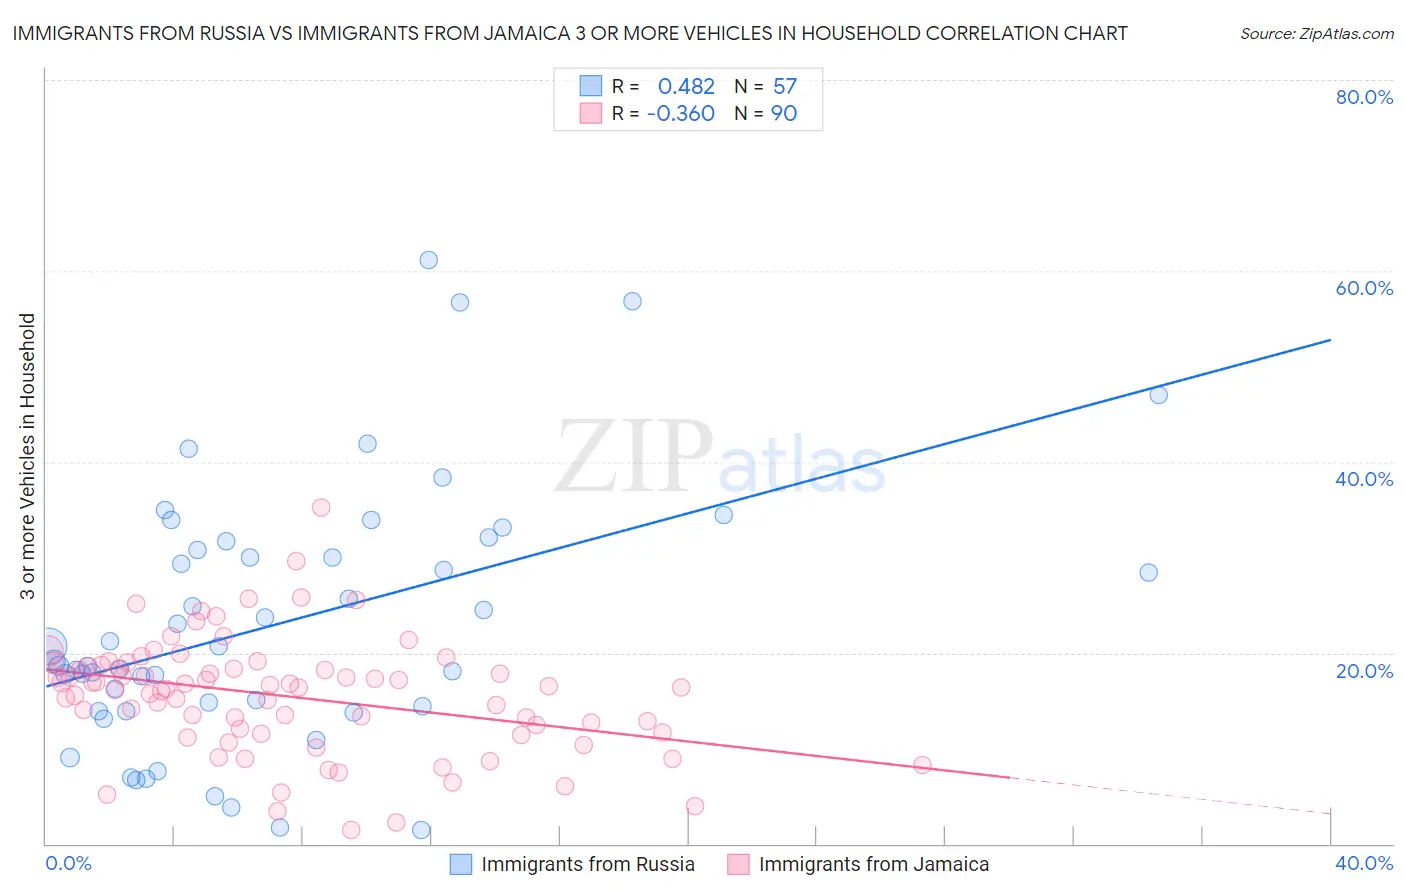
Immigrants from Russia vs Immigrants from Jamaica 3 or more Vehicles in Household
COMPARE
Immigrants from Russia
Immigrants from Jamaica
3 or more Vehicles in Household
3 or more Vehicles in Household Comparison
Immigrants from Russia
Immigrants from Jamaica
16.9%
3 OR MORE VEHICLES IN HOUSEHOLD
0.1/ 100
METRIC RATING
295th/ 347
METRIC RANK
14.7%
3 OR MORE VEHICLES IN HOUSEHOLD
0.0/ 100
METRIC RATING
321st/ 347
METRIC RANK
Immigrants from Russia vs Immigrants from Jamaica 3 or more Vehicles in Household Correlation Chart
The statistical analysis conducted on geographies consisting of 347,621,563 people shows a moderate positive correlation between the proportion of Immigrants from Russia and percentage of households with 3 or more vehicles available in the United States with a correlation coefficient (R) of 0.482 and weighted average of 16.9%. Similarly, the statistical analysis conducted on geographies consisting of 301,546,792 people shows a mild negative correlation between the proportion of Immigrants from Jamaica and percentage of households with 3 or more vehicles available in the United States with a correlation coefficient (R) of -0.360 and weighted average of 14.7%, a difference of 15.2%.
3 or more Vehicles in Household Correlation Summary
| Measurement | Immigrants from Russia | Immigrants from Jamaica |
| Minimum | 1.4% | 1.5% |
| Maximum | 61.1% | 35.2% |
| Range | 59.7% | 33.7% |
| Mean | 23.0% | 15.5% |
| Median | 19.1% | 16.4% |
| Interquartile 25% (IQ1) | 14.1% | 11.7% |
| Interquartile 75% (IQ3) | 31.2% | 18.7% |
| Interquartile Range (IQR) | 17.1% | 7.0% |
| Standard Deviation (Sample) | 13.5% | 6.0% |
| Standard Deviation (Population) | 13.3% | 6.0% |
Similar Demographics by 3 or more Vehicles in Household
Demographics Similar to Immigrants from Russia by 3 or more Vehicles in Household
In terms of 3 or more vehicles in household, the demographic groups most similar to Immigrants from Russia are Immigrants from Western Africa (16.9%, a difference of 0.050%), Bahamian (16.9%, a difference of 0.16%), Immigrants from Spain (17.0%, a difference of 0.25%), Immigrants from Congo (17.0%, a difference of 0.36%), and Inupiat (16.9%, a difference of 0.36%).
| Demographics | Rating | Rank | 3 or more Vehicles in Household |
| Immigrants | Uruguay | 0.2 /100 | #288 | Tragic 17.1% |
| Immigrants | Liberia | 0.1 /100 | #289 | Tragic 17.1% |
| Liberians | 0.1 /100 | #290 | Tragic 17.0% |
| Immigrants | Congo | 0.1 /100 | #291 | Tragic 17.0% |
| Immigrants | Spain | 0.1 /100 | #292 | Tragic 17.0% |
| Bahamians | 0.1 /100 | #293 | Tragic 16.9% |
| Immigrants | Western Africa | 0.1 /100 | #294 | Tragic 16.9% |
| Immigrants | Russia | 0.1 /100 | #295 | Tragic 16.9% |
| Inupiat | 0.1 /100 | #296 | Tragic 16.9% |
| Israelis | 0.1 /100 | #297 | Tragic 16.8% |
| Immigrants | Zaire | 0.1 /100 | #298 | Tragic 16.7% |
| Immigrants | South America | 0.1 /100 | #299 | Tragic 16.7% |
| Cypriots | 0.0 /100 | #300 | Tragic 16.6% |
| Paraguayans | 0.0 /100 | #301 | Tragic 16.6% |
| Immigrants | Greece | 0.0 /100 | #302 | Tragic 16.5% |
Demographics Similar to Immigrants from Jamaica by 3 or more Vehicles in Household
In terms of 3 or more vehicles in household, the demographic groups most similar to Immigrants from Jamaica are Immigrants from West Indies (14.6%, a difference of 0.31%), Immigrants from Caribbean (14.6%, a difference of 0.75%), Yup'ik (14.8%, a difference of 1.1%), Cape Verdean (15.0%, a difference of 2.2%), and Immigrants from Yemen (14.2%, a difference of 3.1%).
| Demographics | Rating | Rank | 3 or more Vehicles in Household |
| Immigrants | Belarus | 0.0 /100 | #314 | Tragic 15.5% |
| Haitians | 0.0 /100 | #315 | Tragic 15.5% |
| U.S. Virgin Islanders | 0.0 /100 | #316 | Tragic 15.4% |
| Jamaicans | 0.0 /100 | #317 | Tragic 15.2% |
| Immigrants | Haiti | 0.0 /100 | #318 | Tragic 15.2% |
| Cape Verdeans | 0.0 /100 | #319 | Tragic 15.0% |
| Yup'ik | 0.0 /100 | #320 | Tragic 14.8% |
| Immigrants | Jamaica | 0.0 /100 | #321 | Tragic 14.7% |
| Immigrants | West Indies | 0.0 /100 | #322 | Tragic 14.6% |
| Immigrants | Caribbean | 0.0 /100 | #323 | Tragic 14.6% |
| Immigrants | Yemen | 0.0 /100 | #324 | Tragic 14.2% |
| Senegalese | 0.0 /100 | #325 | Tragic 14.2% |
| Soviet Union | 0.0 /100 | #326 | Tragic 14.2% |
| Ecuadorians | 0.0 /100 | #327 | Tragic 14.1% |
| Immigrants | Albania | 0.0 /100 | #328 | Tragic 14.0% |