German vs Ottawa 3 or more Vehicles in Household
COMPARE
German
Ottawa
3 or more Vehicles in Household
3 or more Vehicles in Household Comparison
Germans
Ottawa
22.7%
3 OR MORE VEHICLES IN HOUSEHOLD
100.0/ 100
METRIC RATING
41st/ 347
METRIC RANK
20.1%
3 OR MORE VEHICLES IN HOUSEHOLD
84.9/ 100
METRIC RATING
141st/ 347
METRIC RANK
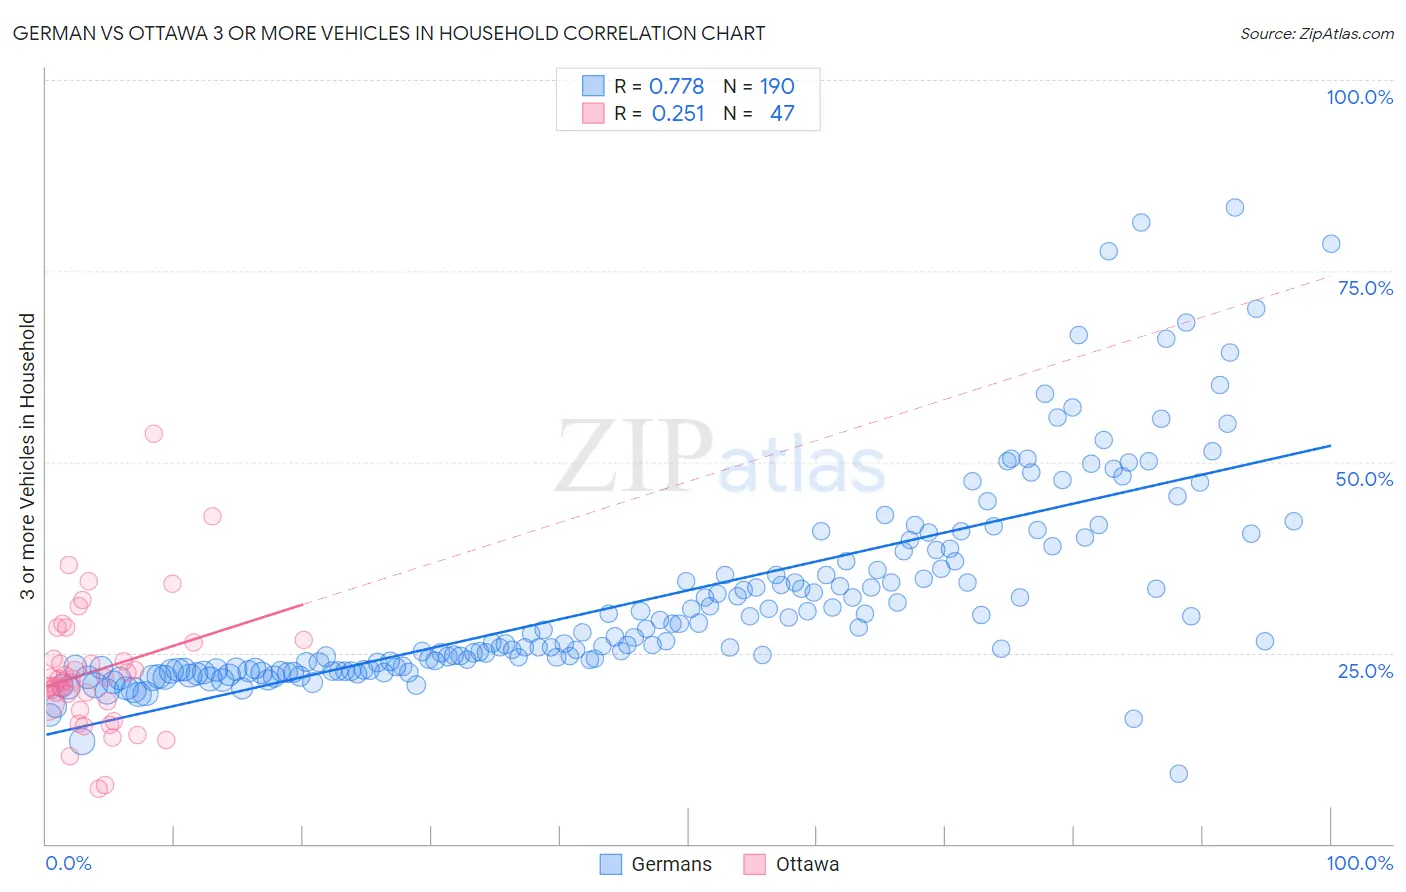
German vs Ottawa 3 or more Vehicles in Household Correlation Chart
The statistical analysis conducted on geographies consisting of 580,173,272 people shows a strong positive correlation between the proportion of Germans and percentage of households with 3 or more vehicles available in the United States with a correlation coefficient (R) of 0.778 and weighted average of 22.7%. Similarly, the statistical analysis conducted on geographies consisting of 49,939,188 people shows a weak positive correlation between the proportion of Ottawa and percentage of households with 3 or more vehicles available in the United States with a correlation coefficient (R) of 0.251 and weighted average of 20.1%, a difference of 13.0%.
3 or more Vehicles in Household Correlation Summary
| Measurement | German | Ottawa |
| Minimum | 9.2% | 7.1% |
| Maximum | 83.3% | 53.7% |
| Range | 74.1% | 46.5% |
| Mean | 32.3% | 22.6% |
| Median | 27.1% | 21.5% |
| Interquartile 25% (IQ1) | 22.8% | 18.5% |
| Interquartile 75% (IQ3) | 37.0% | 26.3% |
| Interquartile Range (IQR) | 14.2% | 7.8% |
| Standard Deviation (Sample) | 13.4% | 8.4% |
| Standard Deviation (Population) | 13.4% | 8.3% |
Similar Demographics by 3 or more Vehicles in Household
Demographics Similar to Germans by 3 or more Vehicles in Household
In terms of 3 or more vehicles in household, the demographic groups most similar to Germans are Native/Alaskan (22.7%, a difference of 0.0%), Osage (22.7%, a difference of 0.12%), Cheyenne (22.7%, a difference of 0.25%), Ute (22.7%, a difference of 0.35%), and European (22.9%, a difference of 0.47%).
| Demographics | Rating | Rank | 3 or more Vehicles in Household |
| Swiss | 100.0 /100 | #34 | Exceptional 23.0% |
| Choctaw | 100.0 /100 | #35 | Exceptional 23.0% |
| Cherokee | 100.0 /100 | #36 | Exceptional 23.0% |
| Swedes | 100.0 /100 | #37 | Exceptional 23.0% |
| Dutch | 100.0 /100 | #38 | Exceptional 22.9% |
| Yaqui | 100.0 /100 | #39 | Exceptional 22.9% |
| Europeans | 100.0 /100 | #40 | Exceptional 22.9% |
| Germans | 100.0 /100 | #41 | Exceptional 22.7% |
| Natives/Alaskans | 100.0 /100 | #42 | Exceptional 22.7% |
| Osage | 100.0 /100 | #43 | Exceptional 22.7% |
| Cheyenne | 100.0 /100 | #44 | Exceptional 22.7% |
| Ute | 100.0 /100 | #45 | Exceptional 22.7% |
| Americans | 100.0 /100 | #46 | Exceptional 22.6% |
| Malaysians | 100.0 /100 | #47 | Exceptional 22.6% |
| Scottish | 100.0 /100 | #48 | Exceptional 22.6% |
Demographics Similar to Ottawa by 3 or more Vehicles in Household
In terms of 3 or more vehicles in household, the demographic groups most similar to Ottawa are French American Indian (20.1%, a difference of 0.060%), Jordanian (20.1%, a difference of 0.060%), Lithuanian (20.1%, a difference of 0.070%), Slovene (20.2%, a difference of 0.090%), and Iranian (20.1%, a difference of 0.12%).
| Demographics | Rating | Rank | 3 or more Vehicles in Household |
| Poles | 87.3 /100 | #134 | Excellent 20.2% |
| Immigrants | India | 87.2 /100 | #135 | Excellent 20.2% |
| Immigrants | Nicaragua | 87.1 /100 | #136 | Excellent 20.2% |
| Immigrants | Iraq | 87.1 /100 | #137 | Excellent 20.2% |
| Aleuts | 86.3 /100 | #138 | Excellent 20.2% |
| Slovenes | 85.5 /100 | #139 | Excellent 20.2% |
| French American Indians | 85.3 /100 | #140 | Excellent 20.1% |
| Ottawa | 84.9 /100 | #141 | Excellent 20.1% |
| Jordanians | 84.4 /100 | #142 | Excellent 20.1% |
| Lithuanians | 84.4 /100 | #143 | Excellent 20.1% |
| Iranians | 84.0 /100 | #144 | Excellent 20.1% |
| Palestinians | 83.9 /100 | #145 | Excellent 20.1% |
| Australians | 83.6 /100 | #146 | Excellent 20.1% |
| Slovaks | 83.0 /100 | #147 | Excellent 20.1% |
| Guatemalans | 82.6 /100 | #148 | Excellent 20.1% |