Crow vs Ottawa 3 or more Vehicles in Household

COMPARE

Crow
Race
Ancestry
AfghanAfricanAlaska NativeAlaskan AthabascanAlbanianAleutAlsatianAmericanApacheArabArapahoArgentineanArmenianAssyrian/Chaldean/SyriacAustralianAustrianBahamianBangladeshiBarbadianBasqueBelgianBelizeanBermudanBhutaneseBlackfeetBolivianBrazilianBritishBritish West IndianBulgarianBurmeseCajunCambodianCanadianCape VerdeanCarpatho RusynCelticCentral AmericanCentral American IndianCherokeeCheyenneChickasawChileanChineseChippewaChoctawColombianColvilleComancheCosta RicanCreeCreekCroatianCrowCubanCypriotCzechCzechoslovakianDanishDelawareDominicanDutchDutch West IndianEastern EuropeanEcuadorianEgyptianEnglishEstonianEthiopianEuropeanFijianFilipinoFinnishFrenchFrench American IndianFrench CanadianGermanGerman RussianGhanaianGreekGuamanian/ChamorroGuatemalanGuyaneseHaitianHmongHonduranHopiHoumaHungarianIcelanderIndian (Asian)IndonesianInupiatIranianIraqiIrishIroquoisIsraeliItalianJamaicanJapaneseJordanianKenyanKiowaKoreanLaotianLatvianLebaneseLiberianLithuanianLumbeeLuxembourgerMacedonianMalaysianMalteseMarshalleseMenomineeMexicanMexican American IndianMongolianMoroccanNative HawaiianNavajoNepaleseNew ZealanderNicaraguanNigerianNorthern EuropeanNorwegianOkinawanOsagePaiutePakistaniPalestinianPanamanianParaguayanPennsylvania GermanPeruvianPimaPolishPortuguesePotawatomiPuebloPuerto RicanPuget Sound SalishRomanianRussianSalvadoranSamoanScandinavianScotch-IrishScottishSeminoleSenegaleseSerbianShoshoneSierra LeoneanSiouxSlavicSlovakSloveneSomaliSouth AfricanSouth AmericanSouth American IndianSoviet UnionSpaniardSpanishSpanish AmericanSpanish American IndianSri LankanSubsaharan AfricanSudaneseSwedishSwissSyrianTaiwaneseThaiTlingit-HaidaTohono O'OdhamTonganTrinidadian and TobagonianTsimshianTurkishU.S. Virgin IslanderUgandanUkrainianUruguayanUteVenezuelanVietnameseWelshWest IndianYakamaYaquiYugoslavianYumanYup'ikZimbabwean
Immigration
NonimmigrantsImmigrantsAfghanistanAfricaAlbaniaArgentinaArmeniaAsiaAustraliaAustriaBahamasBangladeshBarbadosBelarusBelgiumBelizeBoliviaBosnia and HerzegovinaBrazilBulgariaBurma/MyanmarCabo VerdeCambodiaCameroonCanadaCaribbeanCentral AmericaChileChinaColombiaCongoCosta RicaCroatiaCubaCzechoslovakiaDenmarkDominicaDominican RepublicEastern AfricaEastern AsiaEastern EuropeEcuadorEgyptEl SalvadorEnglandEritreaEthiopiaEuropeFijiFranceGermanyGhanaGreeceGrenadaGuatemalaGuyanaHaitiHondurasHong KongHungaryIndiaIndonesiaIranIraqIrelandIsraelItalyJamaicaJapanJordanKazakhstanKenyaKoreaKuwaitLaosLatin AmericaLatviaLebanonLiberiaLithuaniaMalaysiaMexicoMicronesiaMiddle AfricaMoldovaMoroccoNepalNetherlandsNicaraguaNigeriaNorth AmericaNorth MacedoniaNorthern AfricaNorthern EuropeNorwayOceaniaPakistanPanamaPeruPhilippinesPolandPortugalRomaniaRussiaSaudi ArabiaScotlandSenegalSerbiaSierra LeoneSingaporeSomaliaSouth AfricaSouth AmericaSouth Central AsiaSouth Eastern AsiaSouthern EuropeSpainSri LankaSt. Vincent and the GrenadinesSudanSwedenSwitzerlandSyriaTaiwanThailandTrinidad and TobagoTurkeyUgandaUkraineUruguayUzbekistanVenezuelaVietnamWest IndiesWestern AfricaWestern AsiaWestern EuropeYemenZaireZimbabweAzores
Ottawa
Race
Ancestry
AfghanAfricanAlaska NativeAlaskan AthabascanAlbanianAleutAlsatianAmericanApacheArabArapahoArgentineanArmenianAssyrian/Chaldean/SyriacAustralianAustrianBahamianBangladeshiBarbadianBasqueBelgianBelizeanBermudanBhutaneseBlackfeetBolivianBrazilianBritishBritish West IndianBulgarianBurmeseCajunCambodianCanadianCape VerdeanCarpatho RusynCelticCentral AmericanCentral American IndianCherokeeCheyenneChickasawChileanChineseChippewaChoctawColombianColvilleComancheCosta RicanCreeCreekCroatianCubanCypriotCzechCzechoslovakianDanishDelawareDominicanDutchDutch West IndianEastern EuropeanEcuadorianEgyptianEnglishEstonianEthiopianEuropeanFijianFilipinoFinnishFrenchFrench American IndianFrench CanadianGermanGerman RussianGhanaianGreekGuamanian/ChamorroGuatemalanGuyaneseHaitianHmongHonduranHopiHoumaHungarianIcelanderIndian (Asian)IndonesianInupiatIranianIraqiIrishIroquoisIsraeliItalianJamaicanJapaneseJordanianKenyanKiowaKoreanLaotianLatvianLebaneseLiberianLithuanianLumbeeLuxembourgerMacedonianMalaysianMalteseMarshalleseMenomineeMexicanMexican American IndianMongolianMoroccanNative HawaiianNavajoNepaleseNew ZealanderNicaraguanNigerianNorthern EuropeanNorwegianOkinawanOsageOttawaPaiutePakistaniPalestinianPanamanianParaguayanPennsylvania GermanPeruvianPimaPolishPortuguesePotawatomiPuebloPuerto RicanPuget Sound SalishRomanianRussianSalvadoranSamoanScandinavianScotch-IrishScottishSeminoleSenegaleseSerbianShoshoneSierra LeoneanSiouxSlavicSlovakSloveneSomaliSouth AfricanSouth AmericanSouth American IndianSoviet UnionSpaniardSpanishSpanish AmericanSpanish American IndianSri LankanSubsaharan AfricanSudaneseSwedishSwissSyrianTaiwaneseThaiTlingit-HaidaTohono O'OdhamTonganTrinidadian and TobagonianTsimshianTurkishU.S. Virgin IslanderUgandanUkrainianUruguayanUteVenezuelanVietnameseWelshWest IndianYakamaYaquiYugoslavianYumanYup'ikZimbabwean
Immigration
NonimmigrantsImmigrantsAfghanistanAfricaAlbaniaArgentinaArmeniaAsiaAustraliaAustriaBahamasBangladeshBarbadosBelarusBelgiumBelizeBoliviaBosnia and HerzegovinaBrazilBulgariaBurma/MyanmarCabo VerdeCambodiaCameroonCanadaCaribbeanCentral AmericaChileChinaColombiaCongoCosta RicaCroatiaCubaCzechoslovakiaDenmarkDominicaDominican RepublicEastern AfricaEastern AsiaEastern EuropeEcuadorEgyptEl SalvadorEnglandEritreaEthiopiaEuropeFijiFranceGermanyGhanaGreeceGrenadaGuatemalaGuyanaHaitiHondurasHong KongHungaryIndiaIndonesiaIranIraqIrelandIsraelItalyJamaicaJapanJordanKazakhstanKenyaKoreaKuwaitLaosLatin AmericaLatviaLebanonLiberiaLithuaniaMalaysiaMexicoMicronesiaMiddle AfricaMoldovaMoroccoNepalNetherlandsNicaraguaNigeriaNorth AmericaNorth MacedoniaNorthern AfricaNorthern EuropeNorwayOceaniaPakistanPanamaPeruPhilippinesPolandPortugalRomaniaRussiaSaudi ArabiaScotlandSenegalSerbiaSierra LeoneSingaporeSomaliaSouth AfricaSouth AmericaSouth Central AsiaSouth Eastern AsiaSouthern EuropeSpainSri LankaSt. Vincent and the GrenadinesSudanSwedenSwitzerlandSyriaTaiwanThailandTrinidad and TobagoTurkeyUgandaUkraineUruguayUzbekistanVenezuelaVietnamWest IndiesWestern AfricaWestern AsiaWestern EuropeYemenZaireZimbabweAzores
3 or more Vehicles in Household
Income
Poverty
Unemployment
Labor Participation
Family Structure
Vehicle Availability
Education Level
Disability

3 or more Vehicles in Household Comparison

Crow

Ottawa

Exceptional
Excellent
22.5%
3 OR MORE VEHICLES IN HOUSEHOLD
100.0/ 100
METRIC RATING
54th/ 347
METRIC RANK
20.1%
3 OR MORE VEHICLES IN HOUSEHOLD
84.9/ 100
METRIC RATING
141st/ 347
METRIC RANK

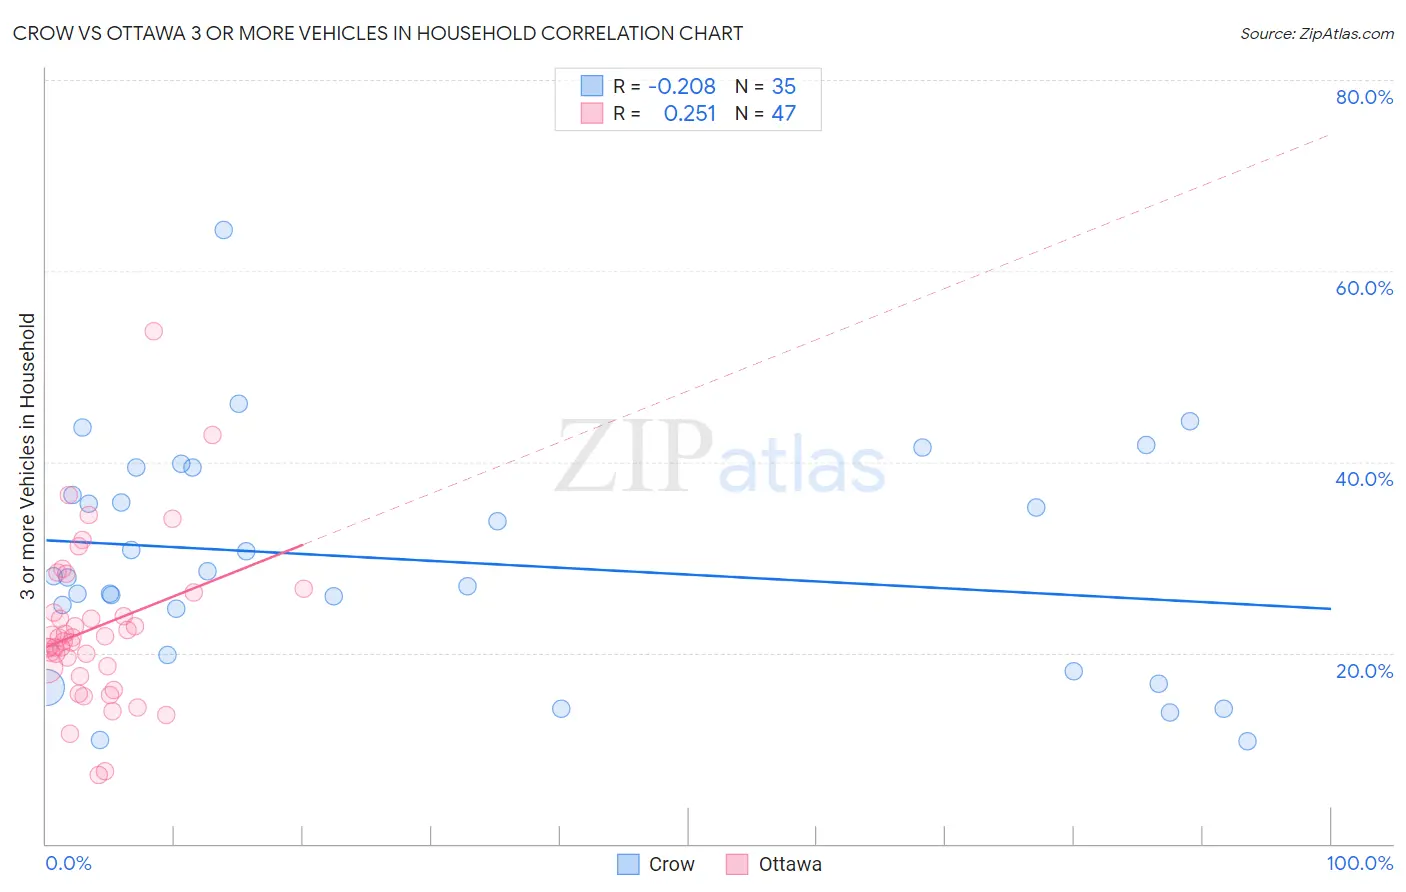
Crow vs Ottawa 3 or more Vehicles in Household Correlation Chart

The statistical analysis conducted on geographies consisting of 59,203,014 people shows a weak negative correlation between the proportion of Crow and percentage of households with 3 or more vehicles available in the United States with a correlation coefficient (R) of -0.208 and weighted average of 22.5%. Similarly, the statistical analysis conducted on geographies consisting of 49,939,188 people shows a weak positive correlation between the proportion of Ottawa and percentage of households with 3 or more vehicles available in the United States with a correlation coefficient (R) of 0.251 and weighted average of 20.1%, a difference of 11.6%.
Crow vs Ottawa 3 or more Vehicles in Household

3 or more Vehicles in Household Correlation Summary

MeasurementCrowOttawa
Minimum10.8%7.1%
Maximum64.3%53.7%
Range53.5%46.5%
Mean29.7%22.6%
Median28.0%21.5%
Interquartile 25% (IQ1)19.8%18.5%
Interquartile 75% (IQ3)39.4%26.3%
Interquartile Range (IQR)19.6%7.8%
Standard Deviation (Sample)11.8%8.4%
Standard Deviation (Population)11.7%8.3%

Similar Demographics by 3 or more Vehicles in Household

Demographics Similar to Crow by 3 or more Vehicles in Household

In terms of 3 or more vehicles in household, the demographic groups most similar to Crow are Czech (22.5%, a difference of 0.21%), Immigrants from Laos (22.4%, a difference of 0.37%), Hispanic or Latino (22.4%, a difference of 0.40%), Welsh (22.6%, a difference of 0.47%), and White/Caucasian (22.6%, a difference of 0.51%).
DemographicsRating | Rank3 or more Vehicles in Household
Malaysians
100.0
/100
|
#47
Exceptional
22.6%
Scottish
100.0
/100
|
#48
Exceptional
22.6%
Scotch-Irish
100.0
/100
|
#49
Exceptional
22.6%
Sioux
100.0
/100
|
#50
Exceptional
22.6%
Whites/Caucasians
100.0
/100
|
#51
Exceptional
22.6%
Welsh
100.0
/100
|
#52
Exceptional
22.6%
Czechs
100.0
/100
|
#53
Exceptional
22.5%
Crow
100.0
/100
|
#54
Exceptional
22.5%
Immigrants | Laos
100.0
/100
|
#55
Exceptional
22.4%
Hispanics or Latinos
100.0
/100
|
#56
Exceptional
22.4%
Pennsylvania Germans
100.0
/100
|
#57
Exceptional
22.3%
Spaniards
100.0
/100
|
#58
Exceptional
22.3%
Navajo
100.0
/100
|
#59
Exceptional
22.3%
Finns
99.9
/100
|
#60
Exceptional
22.3%
Bhutanese
99.9
/100
|
#61
Exceptional
22.2%

Demographics Similar to Ottawa by 3 or more Vehicles in Household

In terms of 3 or more vehicles in household, the demographic groups most similar to Ottawa are French American Indian (20.1%, a difference of 0.060%), Jordanian (20.1%, a difference of 0.060%), Lithuanian (20.1%, a difference of 0.070%), Slovene (20.2%, a difference of 0.090%), and Iranian (20.1%, a difference of 0.12%).
DemographicsRating | Rank3 or more Vehicles in Household
Poles
87.3
/100
|
#134
Excellent
20.2%
Immigrants | India
87.2
/100
|
#135
Excellent
20.2%
Immigrants | Nicaragua
87.1
/100
|
#136
Excellent
20.2%
Immigrants | Iraq
87.1
/100
|
#137
Excellent
20.2%
Aleuts
86.3
/100
|
#138
Excellent
20.2%
Slovenes
85.5
/100
|
#139
Excellent
20.2%
French American Indians
85.3
/100
|
#140
Excellent
20.1%
Ottawa
84.9
/100
|
#141
Excellent
20.1%
Jordanians
84.4
/100
|
#142
Excellent
20.1%
Lithuanians
84.4
/100
|
#143
Excellent
20.1%
Iranians
84.0
/100
|
#144
Excellent
20.1%
Palestinians
83.9
/100
|
#145
Excellent
20.1%
Australians
83.6
/100
|
#146
Excellent
20.1%
Slovaks
83.0
/100
|
#147
Excellent
20.1%
Guatemalans
82.6
/100
|
#148
Excellent
20.1%