Immigrants from Romania vs Ottawa In Labor Force | Age > 16
COMPARE
Immigrants from Romania
Ottawa
In Labor Force | Age > 16
In Labor Force | Age > 16 Comparison
Immigrants from Romania
Ottawa
65.5%
IN LABOR FORCE | AGE > 16
88.6/ 100
METRIC RATING
144th/ 347
METRIC RANK
62.0%
IN LABOR FORCE | AGE > 16
0.0/ 100
METRIC RATING
322nd/ 347
METRIC RANK
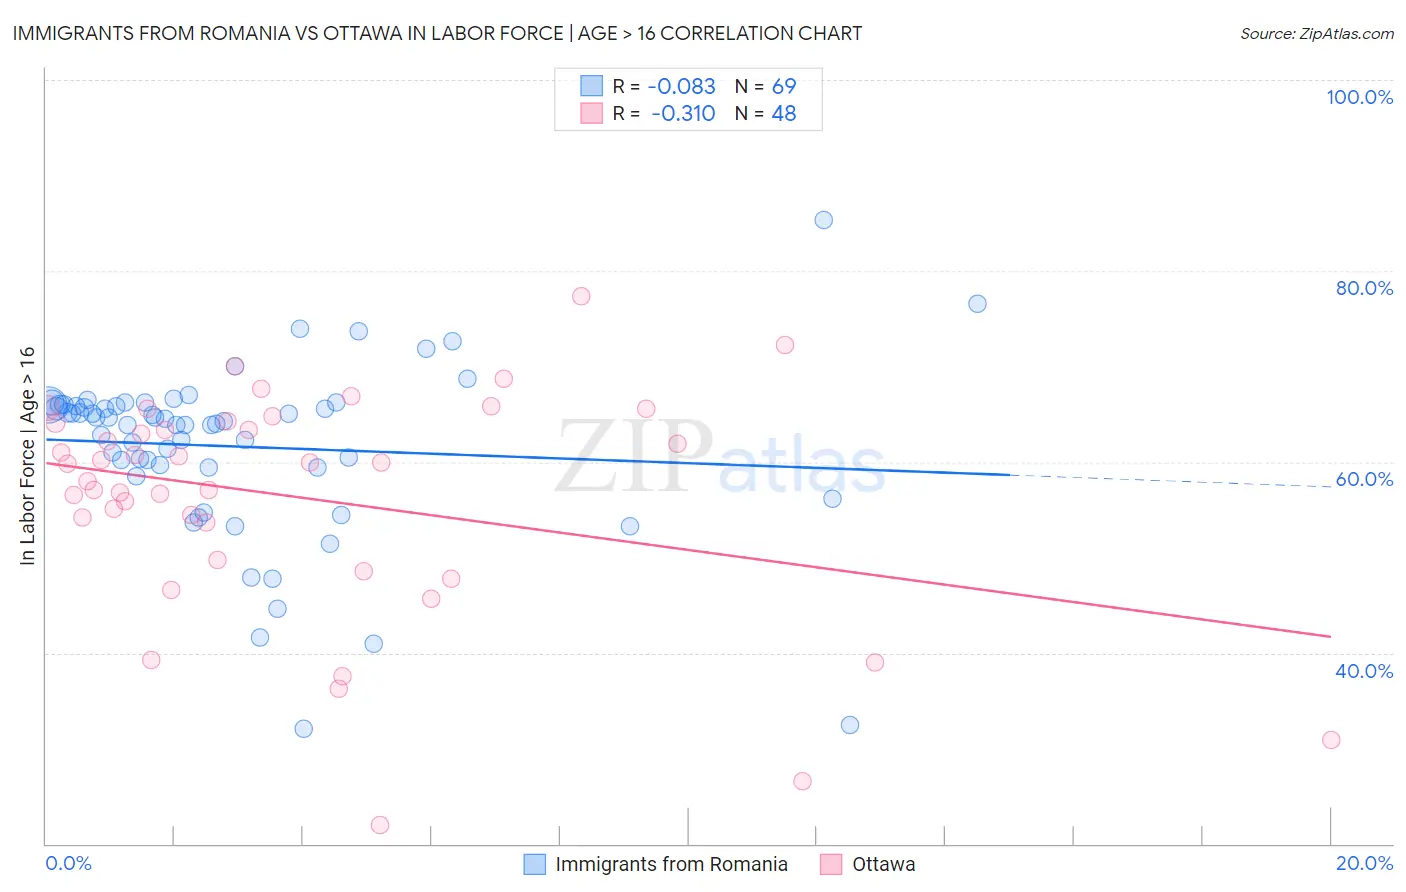
Immigrants from Romania vs Ottawa In Labor Force | Age > 16 Correlation Chart
The statistical analysis conducted on geographies consisting of 257,014,238 people shows a slight negative correlation between the proportion of Immigrants from Romania and labor force participation rate among population ages 16 and over in the United States with a correlation coefficient (R) of -0.083 and weighted average of 65.5%. Similarly, the statistical analysis conducted on geographies consisting of 49,955,399 people shows a mild negative correlation between the proportion of Ottawa and labor force participation rate among population ages 16 and over in the United States with a correlation coefficient (R) of -0.310 and weighted average of 62.0%, a difference of 5.6%.
In Labor Force | Age > 16 Correlation Summary
| Measurement | Immigrants from Romania | Ottawa |
| Minimum | 32.1% | 21.9% |
| Maximum | 85.3% | 77.4% |
| Range | 53.2% | 55.5% |
| Mean | 61.6% | 56.2% |
| Median | 64.3% | 59.9% |
| Interquartile 25% (IQ1) | 59.4% | 51.7% |
| Interquartile 75% (IQ3) | 66.0% | 64.2% |
| Interquartile Range (IQR) | 6.6% | 12.5% |
| Standard Deviation (Sample) | 9.1% | 11.9% |
| Standard Deviation (Population) | 9.0% | 11.7% |
Similar Demographics by In Labor Force | Age > 16
Demographics Similar to Immigrants from Romania by In Labor Force | Age > 16
In terms of in labor force | age > 16, the demographic groups most similar to Immigrants from Romania are Tlingit-Haida (65.5%, a difference of 0.010%), Cypriot (65.5%, a difference of 0.010%), Indian (Asian) (65.5%, a difference of 0.020%), Latvian (65.5%, a difference of 0.020%), and Immigrants from Oceania (65.5%, a difference of 0.030%).
| Demographics | Rating | Rank | In Labor Force | Age > 16 |
| Guamanians/Chamorros | 92.4 /100 | #137 | Exceptional 65.6% |
| Immigrants | West Indies | 92.0 /100 | #138 | Exceptional 65.6% |
| Immigrants | Taiwan | 90.8 /100 | #139 | Exceptional 65.5% |
| Immigrants | Costa Rica | 90.8 /100 | #140 | Exceptional 65.5% |
| Samoans | 90.5 /100 | #141 | Exceptional 65.5% |
| Indians (Asian) | 89.5 /100 | #142 | Excellent 65.5% |
| Latvians | 89.4 /100 | #143 | Excellent 65.5% |
| Immigrants | Romania | 88.6 /100 | #144 | Excellent 65.5% |
| Tlingit-Haida | 88.3 /100 | #145 | Excellent 65.5% |
| Cypriots | 88.2 /100 | #146 | Excellent 65.5% |
| Immigrants | Oceania | 87.5 /100 | #147 | Excellent 65.5% |
| Bhutanese | 86.3 /100 | #148 | Excellent 65.5% |
| Immigrants | Albania | 85.7 /100 | #149 | Excellent 65.4% |
| Immigrants | Immigrants | 81.9 /100 | #150 | Excellent 65.4% |
| Czechs | 81.5 /100 | #151 | Excellent 65.4% |
Demographics Similar to Ottawa by In Labor Force | Age > 16
In terms of in labor force | age > 16, the demographic groups most similar to Ottawa are Seminole (62.0%, a difference of 0.030%), Cheyenne (62.0%, a difference of 0.070%), Cherokee (61.9%, a difference of 0.11%), American (62.1%, a difference of 0.16%), and Yakama (62.1%, a difference of 0.19%).
| Demographics | Rating | Rank | In Labor Force | Age > 16 |
| Potawatomi | 0.0 /100 | #315 | Tragic 62.8% |
| Yup'ik | 0.0 /100 | #316 | Tragic 62.7% |
| Kiowa | 0.0 /100 | #317 | Tragic 62.4% |
| Chickasaw | 0.0 /100 | #318 | Tragic 62.3% |
| Arapaho | 0.0 /100 | #319 | Tragic 62.1% |
| Yakama | 0.0 /100 | #320 | Tragic 62.1% |
| Americans | 0.0 /100 | #321 | Tragic 62.1% |
| Ottawa | 0.0 /100 | #322 | Tragic 62.0% |
| Seminole | 0.0 /100 | #323 | Tragic 62.0% |
| Cheyenne | 0.0 /100 | #324 | Tragic 62.0% |
| Cherokee | 0.0 /100 | #325 | Tragic 61.9% |
| Sioux | 0.0 /100 | #326 | Tragic 61.8% |
| Cajuns | 0.0 /100 | #327 | Tragic 61.8% |
| Dutch West Indians | 0.0 /100 | #328 | Tragic 61.7% |
| Choctaw | 0.0 /100 | #329 | Tragic 61.5% |