Immigrants from Portugal vs Immigrants from Guyana 2 or more Vehicles in Household
COMPARE
Immigrants from Portugal
Immigrants from Guyana
2 or more Vehicles in Household
2 or more Vehicles in Household Comparison
Immigrants from Portugal
Immigrants from Guyana
52.8%
2 OR MORE VEHICLES IN HOUSEHOLD
1.0/ 100
METRIC RATING
252nd/ 347
METRIC RANK
35.0%
2 OR MORE VEHICLES IN HOUSEHOLD
0.0/ 100
METRIC RATING
343rd/ 347
METRIC RANK
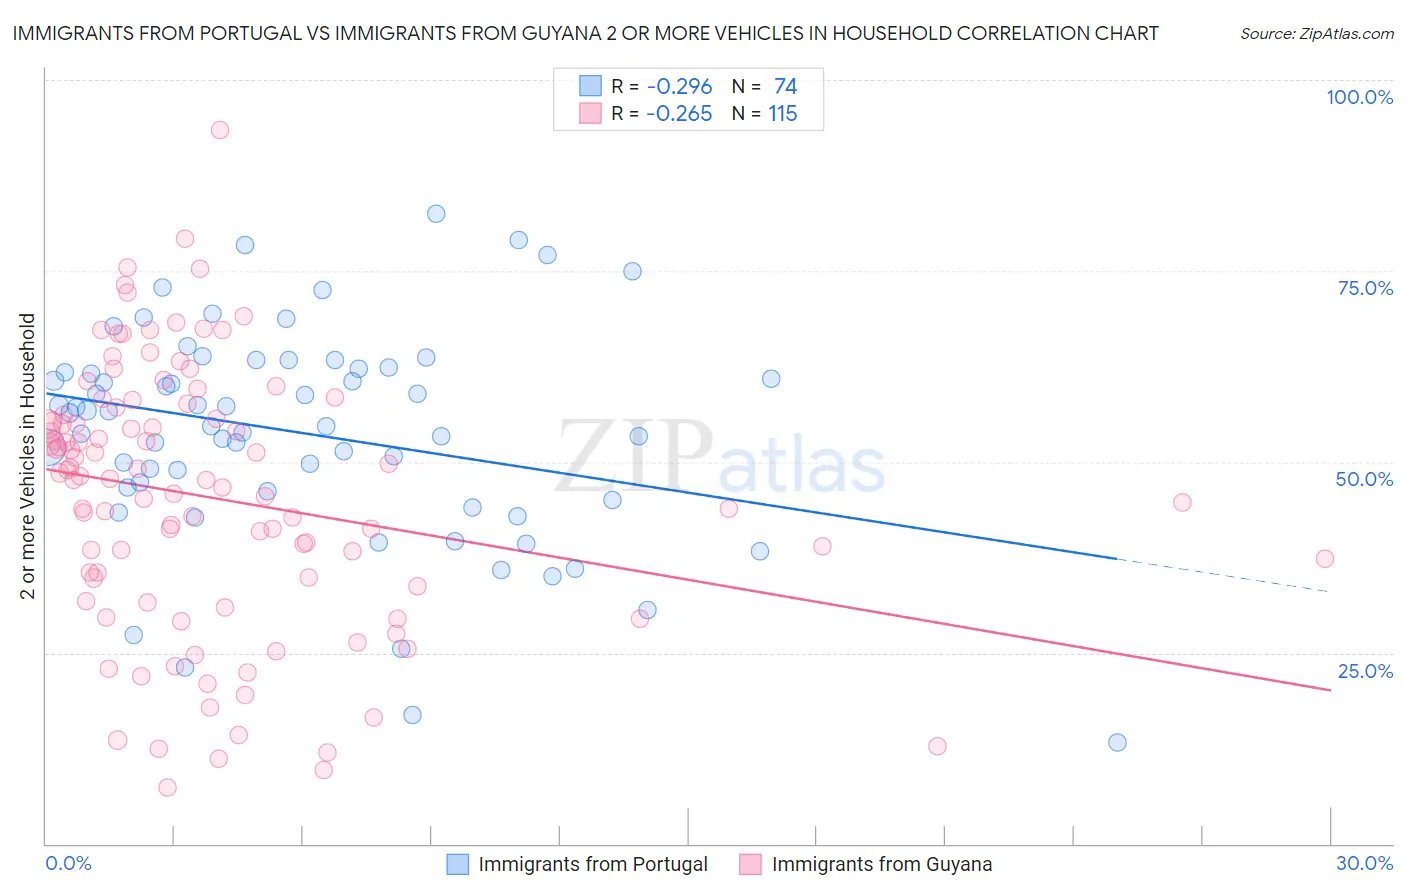
Immigrants from Portugal vs Immigrants from Guyana 2 or more Vehicles in Household Correlation Chart
The statistical analysis conducted on geographies consisting of 174,767,026 people shows a weak negative correlation between the proportion of Immigrants from Portugal and percentage of households with 2 or more vehicles available in the United States with a correlation coefficient (R) of -0.296 and weighted average of 52.8%. Similarly, the statistical analysis conducted on geographies consisting of 183,691,149 people shows a weak negative correlation between the proportion of Immigrants from Guyana and percentage of households with 2 or more vehicles available in the United States with a correlation coefficient (R) of -0.265 and weighted average of 35.0%, a difference of 50.8%.
2 or more Vehicles in Household Correlation Summary
| Measurement | Immigrants from Portugal | Immigrants from Guyana |
| Minimum | 13.2% | 7.4% |
| Maximum | 82.5% | 93.5% |
| Range | 69.3% | 86.1% |
| Mean | 53.7% | 45.2% |
| Median | 55.5% | 47.6% |
| Interquartile 25% (IQ1) | 46.2% | 33.7% |
| Interquartile 75% (IQ3) | 62.2% | 56.2% |
| Interquartile Range (IQR) | 16.0% | 22.5% |
| Standard Deviation (Sample) | 14.1% | 17.3% |
| Standard Deviation (Population) | 14.0% | 17.2% |
Similar Demographics by 2 or more Vehicles in Household
Demographics Similar to Immigrants from Portugal by 2 or more Vehicles in Household
In terms of 2 or more vehicles in household, the demographic groups most similar to Immigrants from Portugal are Immigrants from Sudan (52.8%, a difference of 0.010%), Immigrants from Brazil (52.8%, a difference of 0.050%), Mongolian (52.8%, a difference of 0.050%), Nigerian (52.8%, a difference of 0.050%), and Colombian (52.9%, a difference of 0.10%).
| Demographics | Rating | Rank | 2 or more Vehicles in Household |
| Immigrants | Ethiopia | 1.5 /100 | #245 | Tragic 53.0% |
| Immigrants | Nigeria | 1.2 /100 | #246 | Tragic 52.9% |
| Sierra Leoneans | 1.2 /100 | #247 | Tragic 52.9% |
| Colombians | 1.1 /100 | #248 | Tragic 52.9% |
| Immigrants | Brazil | 1.0 /100 | #249 | Tragic 52.8% |
| Mongolians | 1.0 /100 | #250 | Tragic 52.8% |
| Immigrants | Sudan | 1.0 /100 | #251 | Tragic 52.8% |
| Immigrants | Portugal | 1.0 /100 | #252 | Tragic 52.8% |
| Nigerians | 0.9 /100 | #253 | Tragic 52.8% |
| Immigrants | Malaysia | 0.8 /100 | #254 | Tragic 52.7% |
| Uruguayans | 0.7 /100 | #255 | Tragic 52.7% |
| Immigrants | Eritrea | 0.7 /100 | #256 | Tragic 52.6% |
| Immigrants | Hong Kong | 0.6 /100 | #257 | Tragic 52.6% |
| Central American Indians | 0.6 /100 | #258 | Tragic 52.5% |
| Alsatians | 0.6 /100 | #259 | Tragic 52.5% |
Demographics Similar to Immigrants from Guyana by 2 or more Vehicles in Household
In terms of 2 or more vehicles in household, the demographic groups most similar to Immigrants from Guyana are Yup'ik (34.9%, a difference of 0.17%), Dominican (35.3%, a difference of 0.89%), Guyanese (35.4%, a difference of 1.1%), British West Indian (35.4%, a difference of 1.1%), and Immigrants from Barbados (35.8%, a difference of 2.2%).
| Demographics | Rating | Rank | 2 or more Vehicles in Household |
| Immigrants | Ecuador | 0.0 /100 | #333 | Tragic 40.5% |
| Immigrants | Trinidad and Tobago | 0.0 /100 | #334 | Tragic 40.3% |
| Immigrants | Bangladesh | 0.0 /100 | #335 | Tragic 38.8% |
| Vietnamese | 0.0 /100 | #336 | Tragic 38.5% |
| Barbadians | 0.0 /100 | #337 | Tragic 38.3% |
| Immigrants | Uzbekistan | 0.0 /100 | #338 | Tragic 37.9% |
| Immigrants | Barbados | 0.0 /100 | #339 | Tragic 35.8% |
| British West Indians | 0.0 /100 | #340 | Tragic 35.4% |
| Guyanese | 0.0 /100 | #341 | Tragic 35.4% |
| Dominicans | 0.0 /100 | #342 | Tragic 35.3% |
| Immigrants | Guyana | 0.0 /100 | #343 | Tragic 35.0% |
| Yup'ik | 0.0 /100 | #344 | Tragic 34.9% |
| Immigrants | Dominican Republic | 0.0 /100 | #345 | Tragic 33.2% |
| Immigrants | St. Vincent and the Grenadines | 0.0 /100 | #346 | Tragic 31.0% |
| Immigrants | Grenada | 0.0 /100 | #347 | Tragic 28.7% |