Immigrants from Portugal vs Okinawan 2 or more Vehicles in Household
COMPARE
Immigrants from Portugal
Okinawan
2 or more Vehicles in Household
2 or more Vehicles in Household Comparison
Immigrants from Portugal
Okinawans
52.8%
2 OR MORE VEHICLES IN HOUSEHOLD
1.0/ 100
METRIC RATING
252nd/ 347
METRIC RANK
51.2%
2 OR MORE VEHICLES IN HOUSEHOLD
0.1/ 100
METRIC RATING
288th/ 347
METRIC RANK
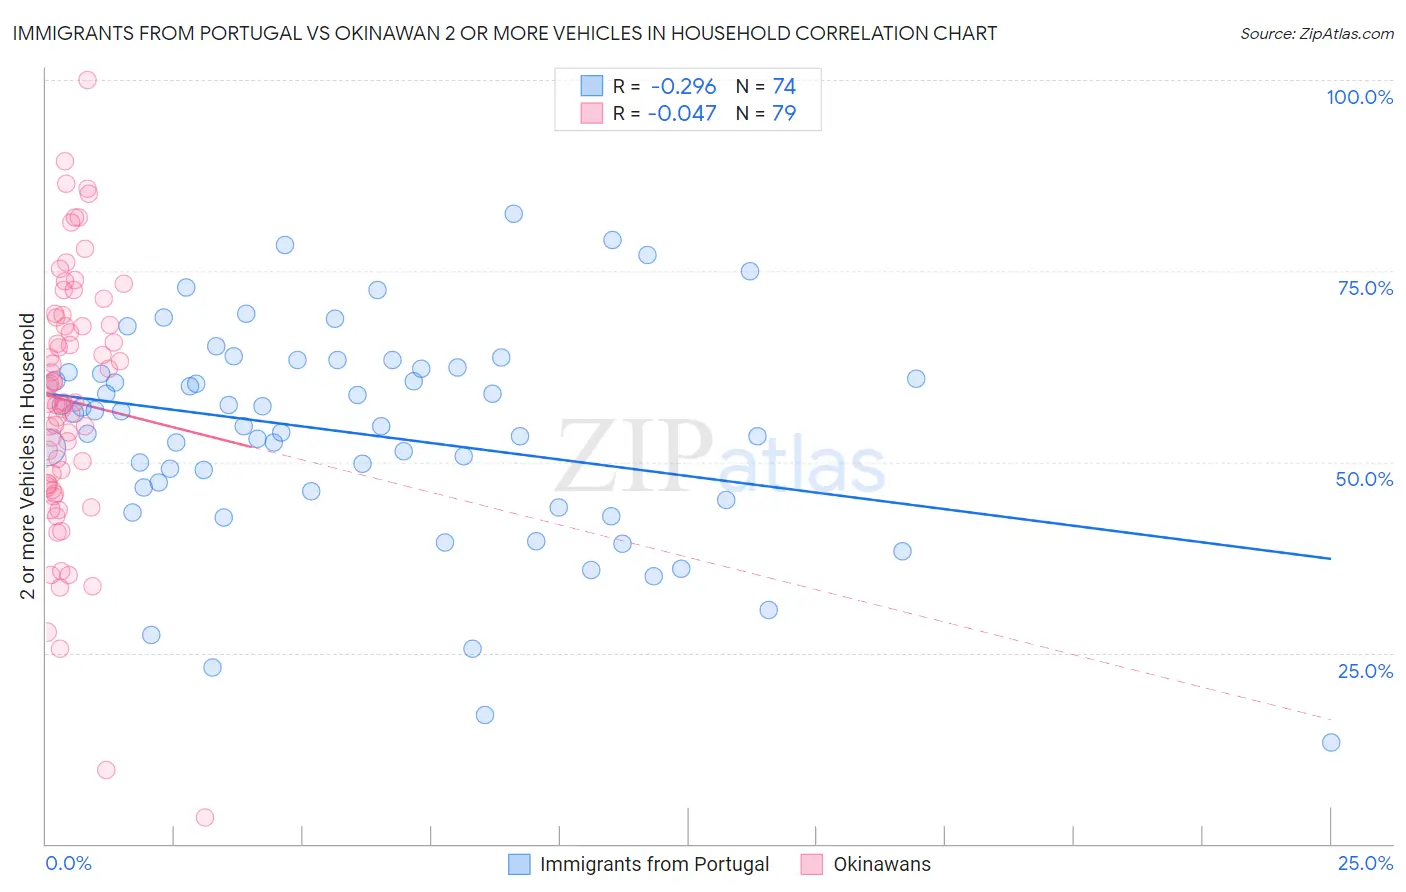
Immigrants from Portugal vs Okinawan 2 or more Vehicles in Household Correlation Chart
The statistical analysis conducted on geographies consisting of 174,767,026 people shows a weak negative correlation between the proportion of Immigrants from Portugal and percentage of households with 2 or more vehicles available in the United States with a correlation coefficient (R) of -0.296 and weighted average of 52.8%. Similarly, the statistical analysis conducted on geographies consisting of 73,742,117 people shows no correlation between the proportion of Okinawans and percentage of households with 2 or more vehicles available in the United States with a correlation coefficient (R) of -0.047 and weighted average of 51.2%, a difference of 3.0%.
2 or more Vehicles in Household Correlation Summary
| Measurement | Immigrants from Portugal | Okinawan |
| Minimum | 13.2% | 3.5% |
| Maximum | 82.5% | 100.0% |
| Range | 69.3% | 96.5% |
| Mean | 53.7% | 58.0% |
| Median | 55.5% | 57.7% |
| Interquartile 25% (IQ1) | 46.2% | 46.9% |
| Interquartile 75% (IQ3) | 62.2% | 68.9% |
| Interquartile Range (IQR) | 16.0% | 22.0% |
| Standard Deviation (Sample) | 14.1% | 17.1% |
| Standard Deviation (Population) | 14.0% | 17.0% |
Similar Demographics by 2 or more Vehicles in Household
Demographics Similar to Immigrants from Portugal by 2 or more Vehicles in Household
In terms of 2 or more vehicles in household, the demographic groups most similar to Immigrants from Portugal are Immigrants from Sudan (52.8%, a difference of 0.010%), Immigrants from Brazil (52.8%, a difference of 0.050%), Mongolian (52.8%, a difference of 0.050%), Nigerian (52.8%, a difference of 0.050%), and Colombian (52.9%, a difference of 0.10%).
| Demographics | Rating | Rank | 2 or more Vehicles in Household |
| Immigrants | Ethiopia | 1.5 /100 | #245 | Tragic 53.0% |
| Immigrants | Nigeria | 1.2 /100 | #246 | Tragic 52.9% |
| Sierra Leoneans | 1.2 /100 | #247 | Tragic 52.9% |
| Colombians | 1.1 /100 | #248 | Tragic 52.9% |
| Immigrants | Brazil | 1.0 /100 | #249 | Tragic 52.8% |
| Mongolians | 1.0 /100 | #250 | Tragic 52.8% |
| Immigrants | Sudan | 1.0 /100 | #251 | Tragic 52.8% |
| Immigrants | Portugal | 1.0 /100 | #252 | Tragic 52.8% |
| Nigerians | 0.9 /100 | #253 | Tragic 52.8% |
| Immigrants | Malaysia | 0.8 /100 | #254 | Tragic 52.7% |
| Uruguayans | 0.7 /100 | #255 | Tragic 52.7% |
| Immigrants | Eritrea | 0.7 /100 | #256 | Tragic 52.6% |
| Immigrants | Hong Kong | 0.6 /100 | #257 | Tragic 52.6% |
| Central American Indians | 0.6 /100 | #258 | Tragic 52.5% |
| Alsatians | 0.6 /100 | #259 | Tragic 52.5% |
Demographics Similar to Okinawans by 2 or more Vehicles in Household
In terms of 2 or more vehicles in household, the demographic groups most similar to Okinawans are Immigrants from Serbia (51.3%, a difference of 0.12%), Immigrants from Liberia (51.3%, a difference of 0.14%), Somali (51.1%, a difference of 0.28%), Immigrants from Uruguay (51.4%, a difference of 0.29%), and Immigrants from Panama (51.1%, a difference of 0.35%).
| Demographics | Rating | Rank | 2 or more Vehicles in Household |
| Immigrants | Kazakhstan | 0.1 /100 | #281 | Tragic 51.6% |
| Bahamians | 0.1 /100 | #282 | Tragic 51.5% |
| Immigrants | China | 0.1 /100 | #283 | Tragic 51.5% |
| Immigrants | Zaire | 0.1 /100 | #284 | Tragic 51.5% |
| Immigrants | Uruguay | 0.1 /100 | #285 | Tragic 51.4% |
| Immigrants | Liberia | 0.1 /100 | #286 | Tragic 51.3% |
| Immigrants | Serbia | 0.1 /100 | #287 | Tragic 51.3% |
| Okinawans | 0.1 /100 | #288 | Tragic 51.2% |
| Somalis | 0.0 /100 | #289 | Tragic 51.1% |
| Immigrants | Panama | 0.0 /100 | #290 | Tragic 51.1% |
| Belizeans | 0.0 /100 | #291 | Tragic 51.0% |
| Immigrants | Ukraine | 0.0 /100 | #292 | Tragic 50.9% |
| Blacks/African Americans | 0.0 /100 | #293 | Tragic 50.9% |
| Bermudans | 0.0 /100 | #294 | Tragic 50.6% |
| Cypriots | 0.0 /100 | #295 | Tragic 50.6% |