Immigrants from Oceania vs Okinawan In Labor Force | Age 35-44
COMPARE
Immigrants from Oceania
Okinawan
In Labor Force | Age 35-44
In Labor Force | Age 35-44 Comparison
Immigrants from Oceania
Okinawans
83.9%
IN LABOR FORCE | AGE 35-44
2.6/ 100
METRIC RATING
234th/ 347
METRIC RANK
84.5%
IN LABOR FORCE | AGE 35-44
73.5/ 100
METRIC RATING
149th/ 347
METRIC RANK
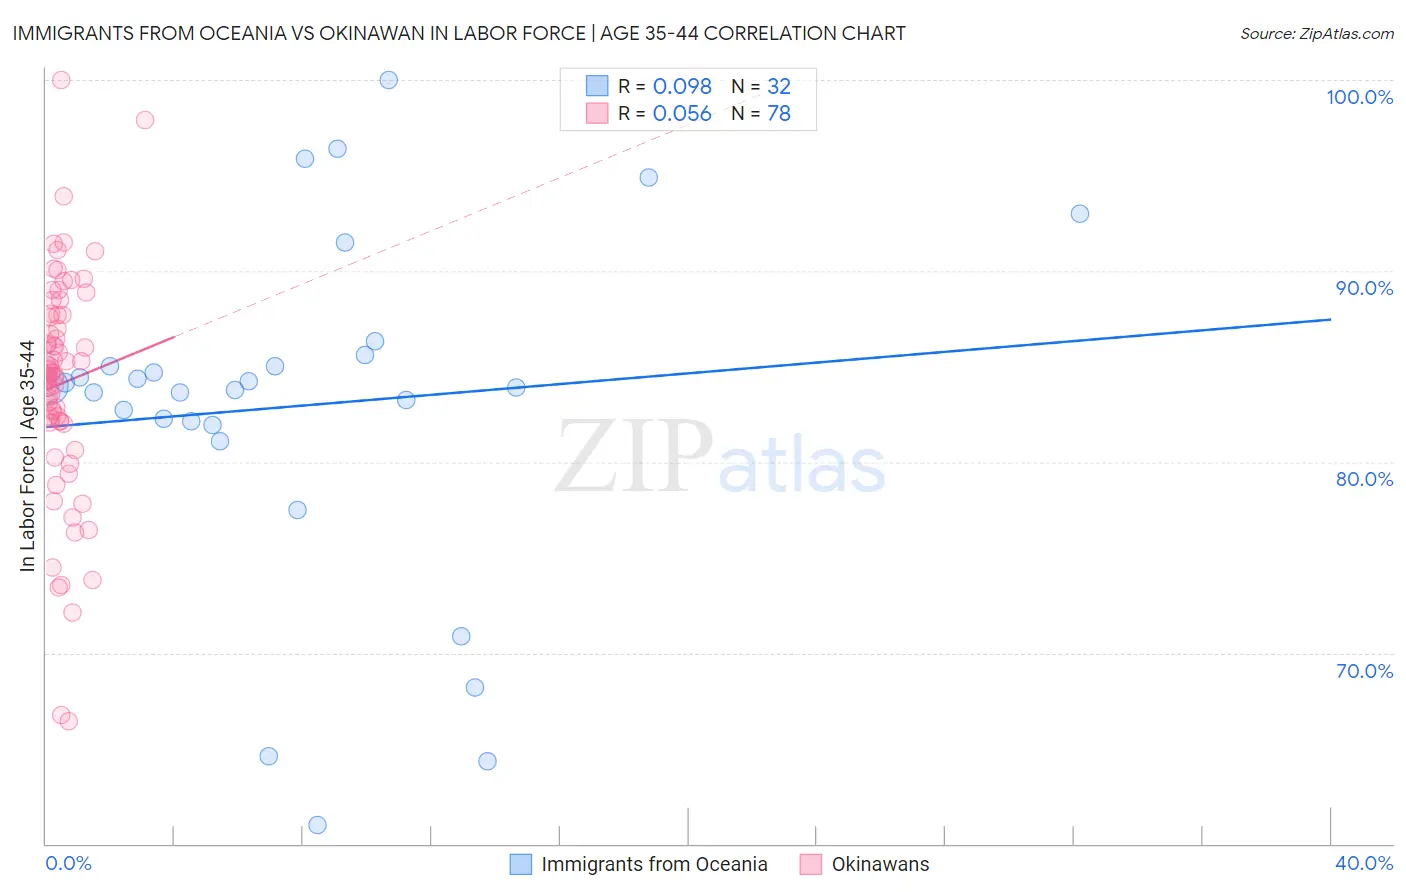
Immigrants from Oceania vs Okinawan In Labor Force | Age 35-44 Correlation Chart
The statistical analysis conducted on geographies consisting of 305,435,378 people shows a slight positive correlation between the proportion of Immigrants from Oceania and labor force participation rate among population between the ages 35 and 44 in the United States with a correlation coefficient (R) of 0.098 and weighted average of 83.9%. Similarly, the statistical analysis conducted on geographies consisting of 73,734,872 people shows a slight positive correlation between the proportion of Okinawans and labor force participation rate among population between the ages 35 and 44 in the United States with a correlation coefficient (R) of 0.056 and weighted average of 84.5%, a difference of 0.75%.
In Labor Force | Age 35-44 Correlation Summary
| Measurement | Immigrants from Oceania | Okinawan |
| Minimum | 61.0% | 66.4% |
| Maximum | 100.0% | 100.0% |
| Range | 39.0% | 33.6% |
| Mean | 82.9% | 84.1% |
| Median | 83.9% | 84.6% |
| Interquartile 25% (IQ1) | 82.0% | 82.1% |
| Interquartile 75% (IQ3) | 85.3% | 87.7% |
| Interquartile Range (IQR) | 3.3% | 5.6% |
| Standard Deviation (Sample) | 9.1% | 5.9% |
| Standard Deviation (Population) | 9.0% | 5.9% |
Similar Demographics by In Labor Force | Age 35-44
Demographics Similar to Immigrants from Oceania by In Labor Force | Age 35-44
In terms of in labor force | age 35-44, the demographic groups most similar to Immigrants from Oceania are Immigrants from Germany (83.9%, a difference of 0.010%), Immigrants from Syria (83.9%, a difference of 0.010%), Native Hawaiian (83.9%, a difference of 0.020%), West Indian (83.9%, a difference of 0.020%), and Scottish (83.9%, a difference of 0.030%).
| Demographics | Rating | Rank | In Labor Force | Age 35-44 |
| British West Indians | 5.3 /100 | #227 | Tragic 84.0% |
| Welsh | 5.3 /100 | #228 | Tragic 84.0% |
| Immigrants | Thailand | 4.7 /100 | #229 | Tragic 84.0% |
| Immigrants | Iraq | 3.7 /100 | #230 | Tragic 83.9% |
| Scottish | 3.2 /100 | #231 | Tragic 83.9% |
| Native Hawaiians | 3.0 /100 | #232 | Tragic 83.9% |
| Immigrants | Germany | 2.8 /100 | #233 | Tragic 83.9% |
| Immigrants | Oceania | 2.6 /100 | #234 | Tragic 83.9% |
| Immigrants | Syria | 2.5 /100 | #235 | Tragic 83.9% |
| West Indians | 2.4 /100 | #236 | Tragic 83.9% |
| English | 1.8 /100 | #237 | Tragic 83.8% |
| Immigrants | Laos | 1.7 /100 | #238 | Tragic 83.8% |
| Celtics | 1.4 /100 | #239 | Tragic 83.8% |
| Arabs | 1.3 /100 | #240 | Tragic 83.8% |
| Iraqis | 1.3 /100 | #241 | Tragic 83.8% |
Demographics Similar to Okinawans by In Labor Force | Age 35-44
In terms of in labor force | age 35-44, the demographic groups most similar to Okinawans are South American Indian (84.5%, a difference of 0.0%), Immigrants from Nigeria (84.5%, a difference of 0.0%), Romanian (84.5%, a difference of 0.010%), Immigrants from Taiwan (84.5%, a difference of 0.020%), and Immigrants from Netherlands (84.5%, a difference of 0.030%).
| Demographics | Rating | Rank | In Labor Force | Age 35-44 |
| Immigrants | Uruguay | 80.1 /100 | #142 | Excellent 84.6% |
| Immigrants | Ukraine | 79.7 /100 | #143 | Good 84.6% |
| Immigrants | Jamaica | 79.4 /100 | #144 | Good 84.6% |
| Immigrants | Saudi Arabia | 79.4 /100 | #145 | Good 84.6% |
| Immigrants | Asia | 78.7 /100 | #146 | Good 84.5% |
| Immigrants | Netherlands | 76.6 /100 | #147 | Good 84.5% |
| South American Indians | 73.6 /100 | #148 | Good 84.5% |
| Okinawans | 73.5 /100 | #149 | Good 84.5% |
| Immigrants | Nigeria | 73.3 /100 | #150 | Good 84.5% |
| Romanians | 72.1 /100 | #151 | Good 84.5% |
| Immigrants | Taiwan | 71.4 /100 | #152 | Good 84.5% |
| Trinidadians and Tobagonians | 69.5 /100 | #153 | Good 84.5% |
| Iranians | 69.4 /100 | #154 | Good 84.5% |
| Immigrants | Switzerland | 65.9 /100 | #155 | Good 84.5% |
| Immigrants | Israel | 64.3 /100 | #156 | Good 84.4% |