Immigrants from Oceania vs Ethiopian Child Poverty Under the Age of 5
COMPARE
Immigrants from Oceania
Ethiopian
Child Poverty Under the Age of 5
Child Poverty Under the Age of 5 Comparison
Immigrants from Oceania
Ethiopians
16.9%
CHILD POVERTY UNDER THE AGE OF 5
67.6/ 100
METRIC RATING
164th/ 347
METRIC RANK
16.5%
CHILD POVERTY UNDER THE AGE OF 5
82.7/ 100
METRIC RATING
144th/ 347
METRIC RANK
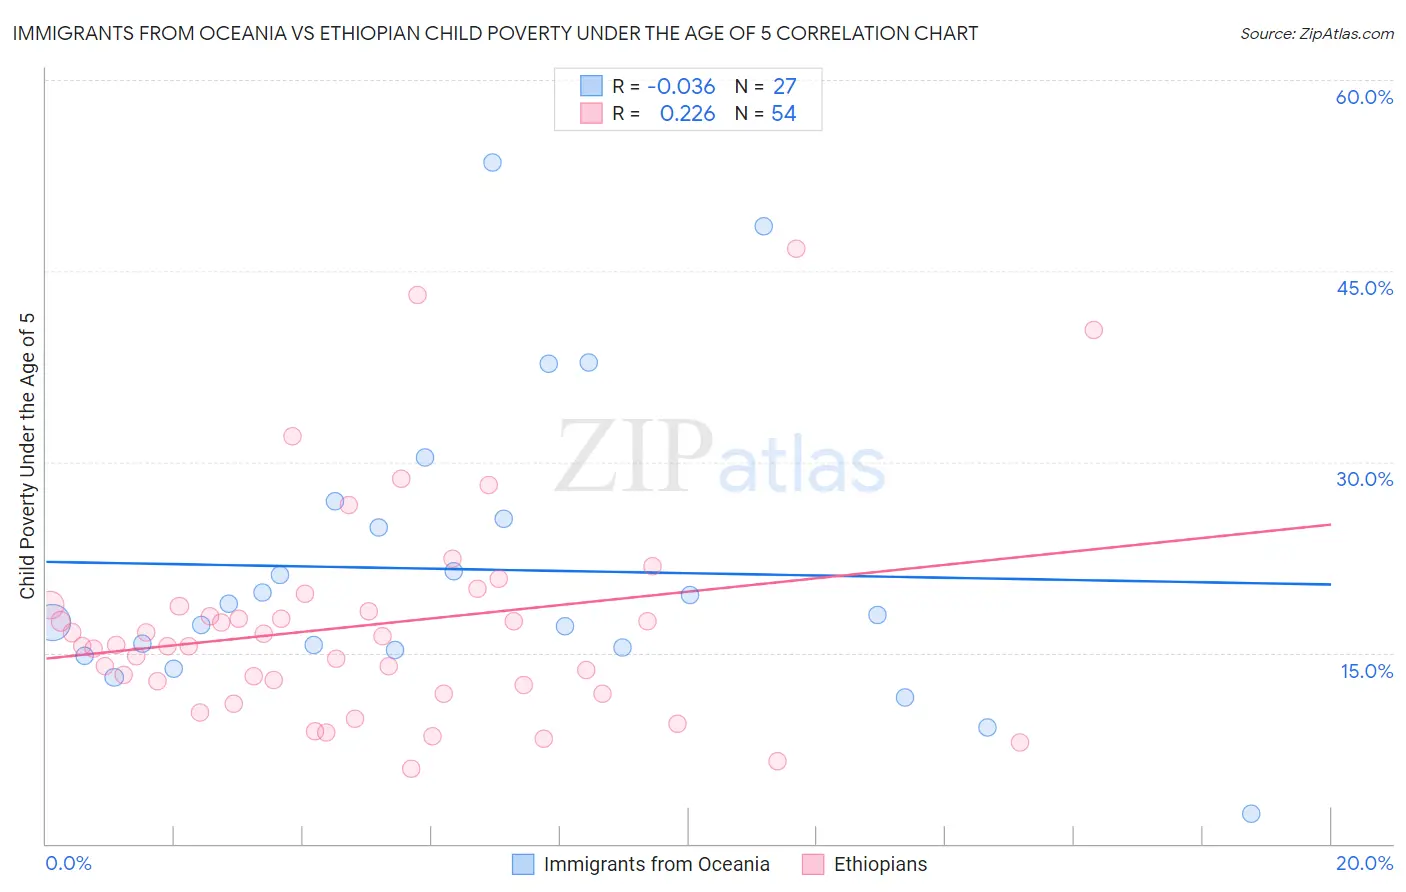
Immigrants from Oceania vs Ethiopian Child Poverty Under the Age of 5 Correlation Chart
The statistical analysis conducted on geographies consisting of 294,567,604 people shows no correlation between the proportion of Immigrants from Oceania and poverty level among children under the age of 5 in the United States with a correlation coefficient (R) of -0.036 and weighted average of 16.9%. Similarly, the statistical analysis conducted on geographies consisting of 218,832,621 people shows a weak positive correlation between the proportion of Ethiopians and poverty level among children under the age of 5 in the United States with a correlation coefficient (R) of 0.226 and weighted average of 16.5%, a difference of 2.2%.
Child Poverty Under the Age of 5 Correlation Summary
| Measurement | Immigrants from Oceania | Ethiopian |
| Minimum | 2.4% | 5.9% |
| Maximum | 53.5% | 46.8% |
| Range | 51.2% | 40.9% |
| Mean | 21.6% | 17.2% |
| Median | 18.0% | 15.6% |
| Interquartile 25% (IQ1) | 15.2% | 12.5% |
| Interquartile 75% (IQ3) | 25.6% | 18.6% |
| Interquartile Range (IQR) | 10.4% | 6.2% |
| Standard Deviation (Sample) | 11.5% | 8.4% |
| Standard Deviation (Population) | 11.3% | 8.4% |
Demographics Similar to Immigrants from Oceania and Ethiopians by Child Poverty Under the Age of 5
In terms of child poverty under the age of 5, the demographic groups most similar to Immigrants from Oceania are Scottish (16.9%, a difference of 0.12%), Costa Rican (16.9%, a difference of 0.27%), English (16.8%, a difference of 0.34%), Irish (16.8%, a difference of 0.56%), and Immigrants from Syria (16.8%, a difference of 0.58%). Similarly, the demographic groups most similar to Ethiopians are Immigrants from Ethiopia (16.6%, a difference of 0.11%), Israeli (16.6%, a difference of 0.12%), Immigrants from Nepal (16.6%, a difference of 0.44%), Syrian (16.6%, a difference of 0.63%), and New Zealander (16.6%, a difference of 0.69%).
| Demographics | Rating | Rank | Child Poverty Under the Age of 5 |
| Ethiopians | 82.7 /100 | #144 | Excellent 16.5% |
| Immigrants | Ethiopia | 82.1 /100 | #145 | Excellent 16.6% |
| Israelis | 82.0 /100 | #146 | Excellent 16.6% |
| Immigrants | Nepal | 80.3 /100 | #147 | Excellent 16.6% |
| Syrians | 79.1 /100 | #148 | Good 16.6% |
| New Zealanders | 78.7 /100 | #149 | Good 16.6% |
| Colombians | 77.8 /100 | #150 | Good 16.7% |
| Canadians | 77.6 /100 | #151 | Good 16.7% |
| Belgians | 77.2 /100 | #152 | Good 16.7% |
| Dutch | 77.1 /100 | #153 | Good 16.7% |
| Immigrants | Venezuela | 76.0 /100 | #154 | Good 16.7% |
| South Americans | 75.1 /100 | #155 | Good 16.7% |
| Afghans | 74.4 /100 | #156 | Good 16.8% |
| Venezuelans | 73.7 /100 | #157 | Good 16.8% |
| Czechoslovakians | 72.5 /100 | #158 | Good 16.8% |
| Immigrants | Syria | 72.3 /100 | #159 | Good 16.8% |
| Irish | 72.0 /100 | #160 | Good 16.8% |
| English | 70.4 /100 | #161 | Good 16.8% |
| Costa Ricans | 69.8 /100 | #162 | Good 16.9% |
| Scottish | 68.6 /100 | #163 | Good 16.9% |
| Immigrants | Oceania | 67.6 /100 | #164 | Good 16.9% |