Chickasaw vs Ethiopian 3 or more Vehicles in Household
COMPARE
Chickasaw
Ethiopian
3 or more Vehicles in Household
3 or more Vehicles in Household Comparison
Chickasaw
Ethiopians
22.2%
3 OR MORE VEHICLES IN HOUSEHOLD
99.9/ 100
METRIC RATING
63rd/ 347
METRIC RANK
17.9%
3 OR MORE VEHICLES IN HOUSEHOLD
1.2/ 100
METRIC RATING
254th/ 347
METRIC RANK
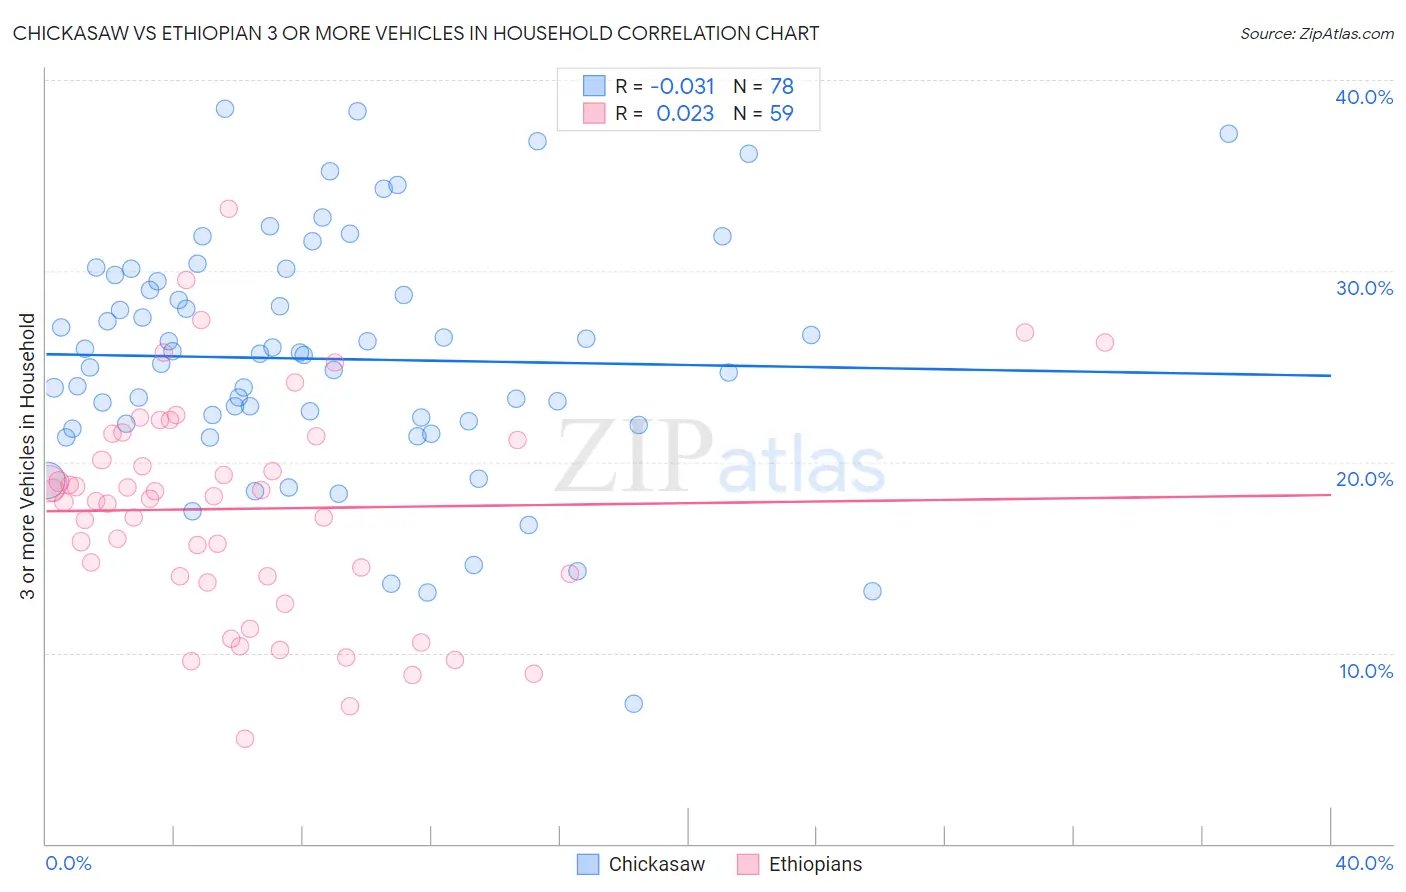
Chickasaw vs Ethiopian 3 or more Vehicles in Household Correlation Chart
The statistical analysis conducted on geographies consisting of 147,670,529 people shows no correlation between the proportion of Chickasaw and percentage of households with 3 or more vehicles available in the United States with a correlation coefficient (R) of -0.031 and weighted average of 22.2%. Similarly, the statistical analysis conducted on geographies consisting of 223,058,389 people shows no correlation between the proportion of Ethiopians and percentage of households with 3 or more vehicles available in the United States with a correlation coefficient (R) of 0.023 and weighted average of 17.9%, a difference of 24.1%.
3 or more Vehicles in Household Correlation Summary
| Measurement | Chickasaw | Ethiopian |
| Minimum | 7.3% | 5.5% |
| Maximum | 38.5% | 33.2% |
| Range | 31.2% | 27.8% |
| Mean | 25.4% | 17.5% |
| Median | 25.6% | 18.0% |
| Interquartile 25% (IQ1) | 22.0% | 14.0% |
| Interquartile 75% (IQ3) | 29.5% | 21.3% |
| Interquartile Range (IQR) | 7.5% | 7.3% |
| Standard Deviation (Sample) | 6.2% | 5.8% |
| Standard Deviation (Population) | 6.2% | 5.7% |
Similar Demographics by 3 or more Vehicles in Household
Demographics Similar to Chickasaw by 3 or more Vehicles in Household
In terms of 3 or more vehicles in household, the demographic groups most similar to Chickasaw are Fijian (22.2%, a difference of 0.16%), Bhutanese (22.2%, a difference of 0.20%), Immigrants from Taiwan (22.1%, a difference of 0.33%), Finnish (22.3%, a difference of 0.36%), and Navajo (22.3%, a difference of 0.45%).
| Demographics | Rating | Rank | 3 or more Vehicles in Household |
| Hispanics or Latinos | 100.0 /100 | #56 | Exceptional 22.4% |
| Pennsylvania Germans | 100.0 /100 | #57 | Exceptional 22.3% |
| Spaniards | 100.0 /100 | #58 | Exceptional 22.3% |
| Navajo | 100.0 /100 | #59 | Exceptional 22.3% |
| Finns | 99.9 /100 | #60 | Exceptional 22.3% |
| Bhutanese | 99.9 /100 | #61 | Exceptional 22.2% |
| Fijians | 99.9 /100 | #62 | Exceptional 22.2% |
| Chickasaw | 99.9 /100 | #63 | Exceptional 22.2% |
| Immigrants | Taiwan | 99.9 /100 | #64 | Exceptional 22.1% |
| Pima | 99.9 /100 | #65 | Exceptional 22.0% |
| Northern Europeans | 99.9 /100 | #66 | Exceptional 22.0% |
| Alaskan Athabascans | 99.9 /100 | #67 | Exceptional 21.9% |
| British | 99.9 /100 | #68 | Exceptional 21.9% |
| Creek | 99.9 /100 | #69 | Exceptional 21.9% |
| Bangladeshis | 99.8 /100 | #70 | Exceptional 21.9% |
Demographics Similar to Ethiopians by 3 or more Vehicles in Household
In terms of 3 or more vehicles in household, the demographic groups most similar to Ethiopians are Immigrants from Ethiopia (17.9%, a difference of 0.0%), Immigrants from Turkey (17.9%, a difference of 0.030%), Subsaharan African (17.9%, a difference of 0.18%), Immigrants from Southern Europe (17.9%, a difference of 0.22%), and Immigrants from Eritrea (17.8%, a difference of 0.23%).
| Demographics | Rating | Rank | 3 or more Vehicles in Household |
| Carpatho Rusyns | 1.9 /100 | #247 | Tragic 18.0% |
| Immigrants | Eastern Africa | 1.8 /100 | #248 | Tragic 18.0% |
| Immigrants | Saudi Arabia | 1.7 /100 | #249 | Tragic 18.0% |
| Venezuelans | 1.7 /100 | #250 | Tragic 18.0% |
| Alsatians | 1.5 /100 | #251 | Tragic 18.0% |
| Immigrants | Southern Europe | 1.4 /100 | #252 | Tragic 17.9% |
| Immigrants | Ethiopia | 1.3 /100 | #253 | Tragic 17.9% |
| Ethiopians | 1.2 /100 | #254 | Tragic 17.9% |
| Immigrants | Turkey | 1.2 /100 | #255 | Tragic 17.9% |
| Sub-Saharan Africans | 1.1 /100 | #256 | Tragic 17.9% |
| Immigrants | Eritrea | 1.1 /100 | #257 | Tragic 17.8% |
| Sudanese | 1.1 /100 | #258 | Tragic 17.8% |
| Uruguayans | 1.0 /100 | #259 | Tragic 17.8% |
| Ugandans | 0.9 /100 | #260 | Tragic 17.8% |
| Immigrants | Northern Africa | 0.9 /100 | #261 | Tragic 17.8% |