Immigrants from North Macedonia vs Immigrants 3 or more Vehicles in Household
COMPARE
Immigrants from North Macedonia
Immigrants
3 or more Vehicles in Household
3 or more Vehicles in Household Comparison
Immigrants from North Macedonia
Immigrants
18.4%
3 OR MORE VEHICLES IN HOUSEHOLD
4.4/ 100
METRIC RATING
234th/ 347
METRIC RANK
20.0%
3 OR MORE VEHICLES IN HOUSEHOLD
80.8/ 100
METRIC RATING
150th/ 347
METRIC RANK
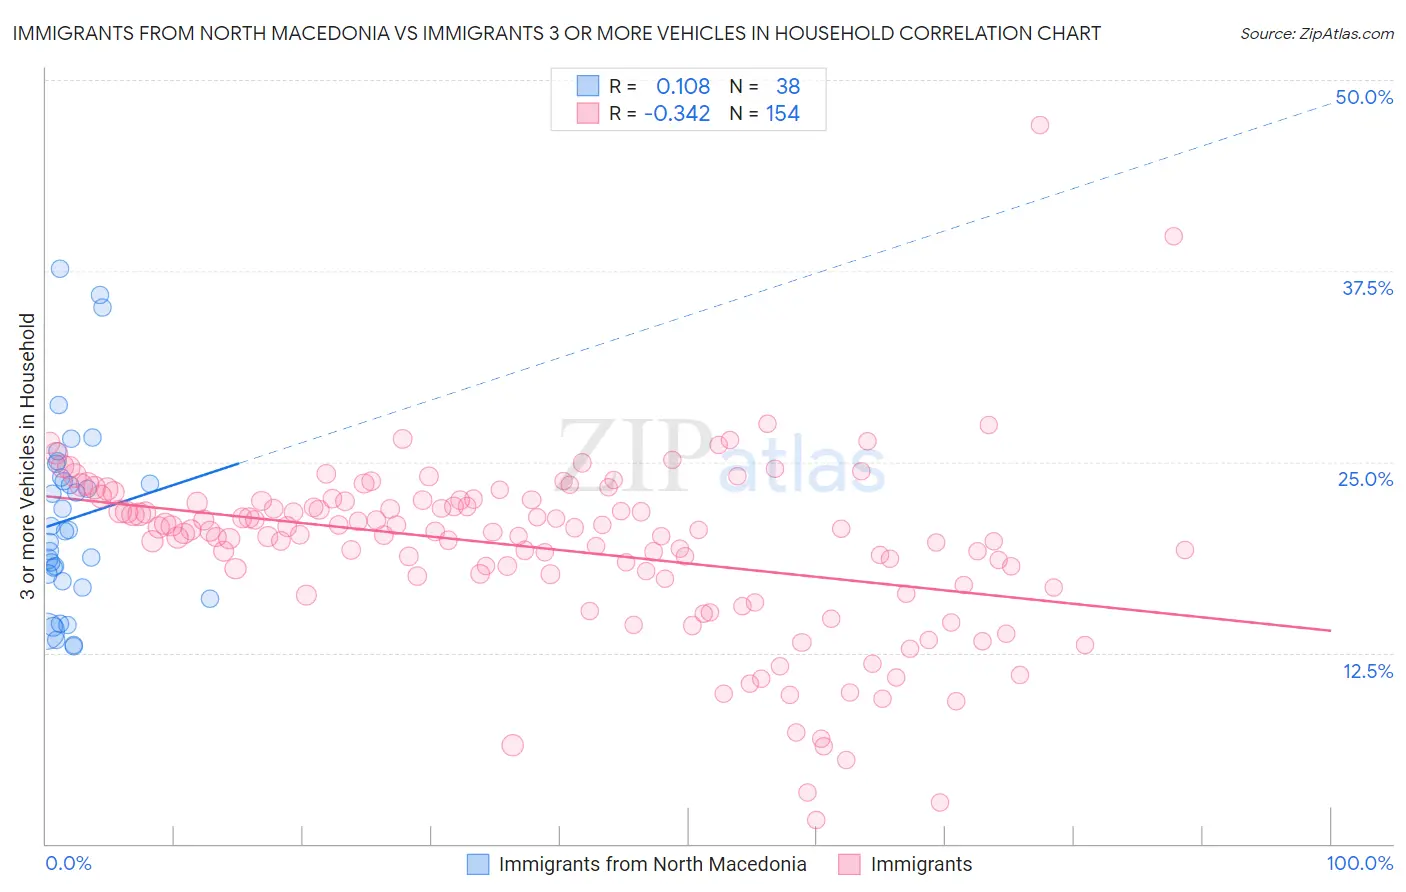
Immigrants from North Macedonia vs Immigrants 3 or more Vehicles in Household Correlation Chart
The statistical analysis conducted on geographies consisting of 74,290,299 people shows a poor positive correlation between the proportion of Immigrants from North Macedonia and percentage of households with 3 or more vehicles available in the United States with a correlation coefficient (R) of 0.108 and weighted average of 18.4%. Similarly, the statistical analysis conducted on geographies consisting of 576,716,995 people shows a mild negative correlation between the proportion of Immigrants and percentage of households with 3 or more vehicles available in the United States with a correlation coefficient (R) of -0.342 and weighted average of 20.0%, a difference of 9.0%.
3 or more Vehicles in Household Correlation Summary
| Measurement | Immigrants from North Macedonia | Immigrants |
| Minimum | 12.9% | 1.6% |
| Maximum | 37.6% | 47.1% |
| Range | 24.7% | 45.5% |
| Mean | 21.3% | 19.3% |
| Median | 20.5% | 20.4% |
| Interquartile 25% (IQ1) | 17.2% | 17.4% |
| Interquartile 75% (IQ3) | 24.0% | 22.4% |
| Interquartile Range (IQR) | 6.8% | 5.1% |
| Standard Deviation (Sample) | 6.1% | 5.9% |
| Standard Deviation (Population) | 6.1% | 5.9% |
Similar Demographics by 3 or more Vehicles in Household
Demographics Similar to Immigrants from North Macedonia by 3 or more Vehicles in Household
In terms of 3 or more vehicles in household, the demographic groups most similar to Immigrants from North Macedonia are Honduran (18.4%, a difference of 0.070%), Immigrants from Uganda (18.4%, a difference of 0.080%), Immigrants from Belgium (18.4%, a difference of 0.15%), Immigrants from Western Asia (18.4%, a difference of 0.17%), and Immigrants from Switzerland (18.4%, a difference of 0.23%).
| Demographics | Rating | Rank | 3 or more Vehicles in Household |
| Immigrants | Singapore | 5.4 /100 | #227 | Tragic 18.4% |
| Turks | 5.4 /100 | #228 | Tragic 18.4% |
| Immigrants | Switzerland | 5.0 /100 | #229 | Tragic 18.4% |
| Immigrants | Western Asia | 4.8 /100 | #230 | Tragic 18.4% |
| Immigrants | Belgium | 4.8 /100 | #231 | Tragic 18.4% |
| Immigrants | Uganda | 4.6 /100 | #232 | Tragic 18.4% |
| Hondurans | 4.6 /100 | #233 | Tragic 18.4% |
| Immigrants | North Macedonia | 4.4 /100 | #234 | Tragic 18.4% |
| Sierra Leoneans | 3.9 /100 | #235 | Tragic 18.3% |
| Immigrants | Malaysia | 3.6 /100 | #236 | Tragic 18.3% |
| Indonesians | 3.5 /100 | #237 | Tragic 18.3% |
| Immigrants | Honduras | 3.1 /100 | #238 | Tragic 18.2% |
| Immigrants | Middle Africa | 3.1 /100 | #239 | Tragic 18.2% |
| Immigrants | China | 2.9 /100 | #240 | Tragic 18.2% |
| Africans | 2.7 /100 | #241 | Tragic 18.2% |
Demographics Similar to Immigrants by 3 or more Vehicles in Household
In terms of 3 or more vehicles in household, the demographic groups most similar to Immigrants are Immigrants from Iran (20.0%, a difference of 0.020%), Taiwanese (20.0%, a difference of 0.020%), Lebanese (20.0%, a difference of 0.12%), Guatemalan (20.1%, a difference of 0.22%), and Slovak (20.1%, a difference of 0.28%).
| Demographics | Rating | Rank | 3 or more Vehicles in Household |
| Lithuanians | 84.4 /100 | #143 | Excellent 20.1% |
| Iranians | 84.0 /100 | #144 | Excellent 20.1% |
| Palestinians | 83.9 /100 | #145 | Excellent 20.1% |
| Australians | 83.6 /100 | #146 | Excellent 20.1% |
| Slovaks | 83.0 /100 | #147 | Excellent 20.1% |
| Guatemalans | 82.6 /100 | #148 | Excellent 20.1% |
| Immigrants | Iran | 80.9 /100 | #149 | Excellent 20.0% |
| Immigrants | Immigrants | 80.8 /100 | #150 | Excellent 20.0% |
| Taiwanese | 80.6 /100 | #151 | Excellent 20.0% |
| Lebanese | 79.8 /100 | #152 | Good 20.0% |
| Yuman | 75.6 /100 | #153 | Good 19.9% |
| Immigrants | Jordan | 75.0 /100 | #154 | Good 19.9% |
| Tlingit-Haida | 73.4 /100 | #155 | Good 19.9% |
| Thais | 71.1 /100 | #156 | Good 19.8% |
| Hungarians | 70.5 /100 | #157 | Good 19.8% |