Immigrants from Nigeria vs West Indian In Labor Force | Age 45-54
COMPARE
Immigrants from Nigeria
West Indian
In Labor Force | Age 45-54
In Labor Force | Age 45-54 Comparison
Immigrants from Nigeria
West Indians
83.0%
IN LABOR FORCE | AGE 45-54
74.1/ 100
METRIC RATING
148th/ 347
METRIC RANK
81.4%
IN LABOR FORCE | AGE 45-54
0.1/ 100
METRIC RATING
267th/ 347
METRIC RANK
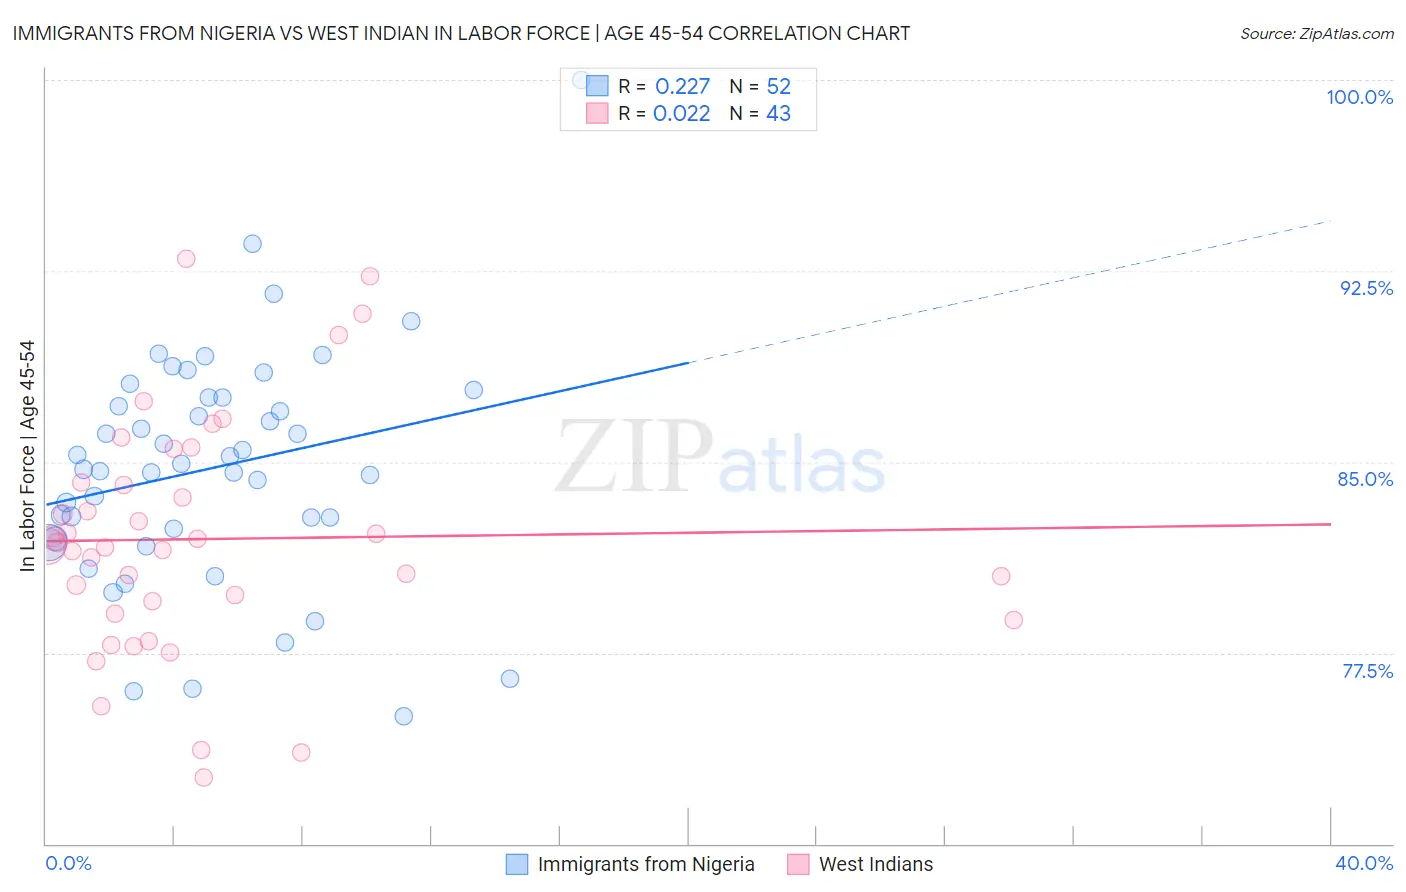
Immigrants from Nigeria vs West Indian In Labor Force | Age 45-54 Correlation Chart
The statistical analysis conducted on geographies consisting of 283,287,443 people shows a weak positive correlation between the proportion of Immigrants from Nigeria and labor force participation rate among population between the ages 45 and 54 in the United States with a correlation coefficient (R) of 0.227 and weighted average of 83.0%. Similarly, the statistical analysis conducted on geographies consisting of 253,868,267 people shows no correlation between the proportion of West Indians and labor force participation rate among population between the ages 45 and 54 in the United States with a correlation coefficient (R) of 0.022 and weighted average of 81.4%, a difference of 1.9%.
In Labor Force | Age 45-54 Correlation Summary
| Measurement | Immigrants from Nigeria | West Indian |
| Minimum | 75.0% | 72.6% |
| Maximum | 100.0% | 93.0% |
| Range | 25.0% | 20.4% |
| Mean | 84.8% | 82.0% |
| Median | 84.8% | 81.7% |
| Interquartile 25% (IQ1) | 82.2% | 79.0% |
| Interquartile 75% (IQ3) | 87.5% | 84.2% |
| Interquartile Range (IQR) | 5.3% | 5.1% |
| Standard Deviation (Sample) | 4.6% | 4.6% |
| Standard Deviation (Population) | 4.6% | 4.6% |
Similar Demographics by In Labor Force | Age 45-54
Demographics Similar to Immigrants from Nigeria by In Labor Force | Age 45-54
In terms of in labor force | age 45-54, the demographic groups most similar to Immigrants from Nigeria are Immigrants from France (83.0%, a difference of 0.010%), Czechoslovakian (83.0%, a difference of 0.010%), Immigrants from Sweden (82.9%, a difference of 0.010%), Romanian (83.0%, a difference of 0.020%), and Immigrants from Netherlands (82.9%, a difference of 0.020%).
| Demographics | Rating | Rank | In Labor Force | Age 45-54 |
| Immigrants | Haiti | 77.9 /100 | #141 | Good 83.0% |
| Immigrants | Scotland | 77.8 /100 | #142 | Good 83.0% |
| Okinawans | 77.0 /100 | #143 | Good 83.0% |
| Soviet Union | 76.8 /100 | #144 | Good 83.0% |
| Romanians | 75.4 /100 | #145 | Good 83.0% |
| Immigrants | France | 75.3 /100 | #146 | Good 83.0% |
| Czechoslovakians | 74.8 /100 | #147 | Good 83.0% |
| Immigrants | Nigeria | 74.1 /100 | #148 | Good 83.0% |
| Immigrants | Sweden | 73.3 /100 | #149 | Good 82.9% |
| Immigrants | Netherlands | 72.6 /100 | #150 | Good 82.9% |
| Koreans | 71.9 /100 | #151 | Good 82.9% |
| Slavs | 71.5 /100 | #152 | Good 82.9% |
| Immigrants | Indonesia | 70.6 /100 | #153 | Good 82.9% |
| Immigrants | Ghana | 70.3 /100 | #154 | Good 82.9% |
| Immigrants | Philippines | 69.0 /100 | #155 | Good 82.9% |
Demographics Similar to West Indians by In Labor Force | Age 45-54
In terms of in labor force | age 45-54, the demographic groups most similar to West Indians are Immigrants from St. Vincent and the Grenadines (81.4%, a difference of 0.0%), Immigrants from Honduras (81.4%, a difference of 0.020%), Alsatian (81.3%, a difference of 0.040%), Bangladeshi (81.3%, a difference of 0.070%), and Honduran (81.4%, a difference of 0.080%).
| Demographics | Rating | Rank | In Labor Force | Age 45-54 |
| Spaniards | 0.1 /100 | #260 | Tragic 81.5% |
| Hawaiians | 0.1 /100 | #261 | Tragic 81.5% |
| Immigrants | Guyana | 0.1 /100 | #262 | Tragic 81.5% |
| Indonesians | 0.1 /100 | #263 | Tragic 81.5% |
| Immigrants | West Indies | 0.1 /100 | #264 | Tragic 81.5% |
| Hondurans | 0.1 /100 | #265 | Tragic 81.4% |
| Immigrants | St. Vincent and the Grenadines | 0.1 /100 | #266 | Tragic 81.4% |
| West Indians | 0.1 /100 | #267 | Tragic 81.4% |
| Immigrants | Honduras | 0.0 /100 | #268 | Tragic 81.4% |
| Alsatians | 0.0 /100 | #269 | Tragic 81.3% |
| Bangladeshis | 0.0 /100 | #270 | Tragic 81.3% |
| Immigrants | Barbados | 0.0 /100 | #271 | Tragic 81.3% |
| Spanish | 0.0 /100 | #272 | Tragic 81.3% |
| Chippewa | 0.0 /100 | #273 | Tragic 81.3% |
| British West Indians | 0.0 /100 | #274 | Tragic 81.2% |