Immigrants from Nigeria vs Lebanese 2 or more Vehicles in Household
COMPARE
Immigrants from Nigeria
Lebanese
2 or more Vehicles in Household
2 or more Vehicles in Household Comparison
Immigrants from Nigeria
Lebanese
52.9%
2 OR MORE VEHICLES IN HOUSEHOLD
1.2/ 100
METRIC RATING
246th/ 347
METRIC RANK
57.6%
2 OR MORE VEHICLES IN HOUSEHOLD
98.3/ 100
METRIC RATING
101st/ 347
METRIC RANK
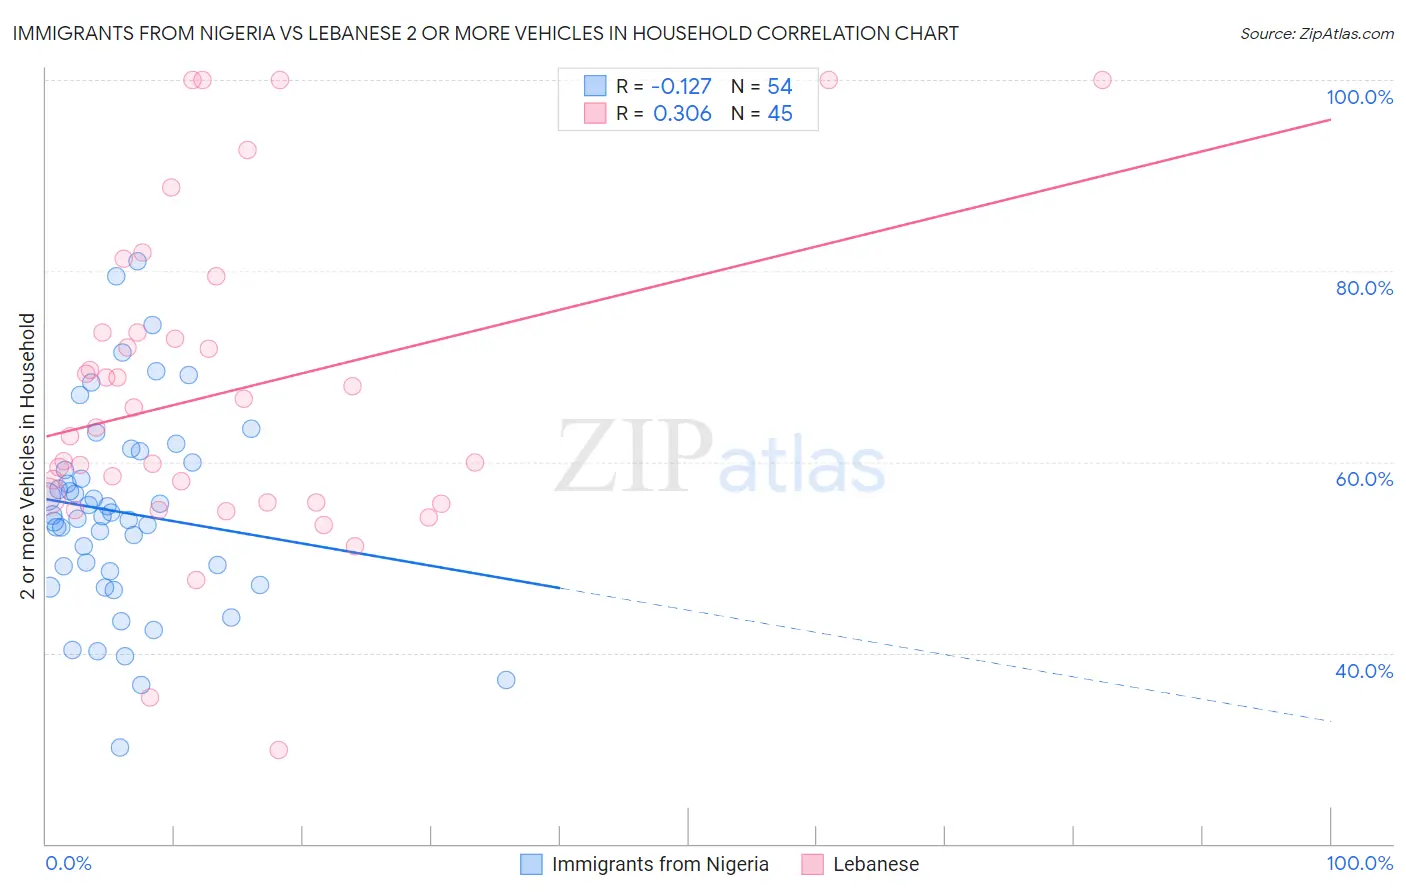
Immigrants from Nigeria vs Lebanese 2 or more Vehicles in Household Correlation Chart
The statistical analysis conducted on geographies consisting of 283,313,070 people shows a poor negative correlation between the proportion of Immigrants from Nigeria and percentage of households with 2 or more vehicles available in the United States with a correlation coefficient (R) of -0.127 and weighted average of 52.9%. Similarly, the statistical analysis conducted on geographies consisting of 401,369,606 people shows a mild positive correlation between the proportion of Lebanese and percentage of households with 2 or more vehicles available in the United States with a correlation coefficient (R) of 0.306 and weighted average of 57.6%, a difference of 8.8%.
2 or more Vehicles in Household Correlation Summary
| Measurement | Immigrants from Nigeria | Lebanese |
| Minimum | 30.1% | 29.8% |
| Maximum | 81.0% | 100.0% |
| Range | 50.9% | 70.2% |
| Mean | 54.7% | 67.2% |
| Median | 54.3% | 63.5% |
| Interquartile 25% (IQ1) | 48.5% | 55.8% |
| Interquartile 75% (IQ3) | 60.0% | 73.5% |
| Interquartile Range (IQR) | 11.5% | 17.8% |
| Standard Deviation (Sample) | 10.5% | 16.6% |
| Standard Deviation (Population) | 10.4% | 16.4% |
Similar Demographics by 2 or more Vehicles in Household
Demographics Similar to Immigrants from Nigeria by 2 or more Vehicles in Household
In terms of 2 or more vehicles in household, the demographic groups most similar to Immigrants from Nigeria are Sierra Leonean (52.9%, a difference of 0.030%), Colombian (52.9%, a difference of 0.15%), Immigrants from Ethiopia (53.0%, a difference of 0.20%), Immigrants from Brazil (52.8%, a difference of 0.20%), and Mongolian (52.8%, a difference of 0.21%).
| Demographics | Rating | Rank | 2 or more Vehicles in Household |
| Cambodians | 2.3 /100 | #239 | Tragic 53.3% |
| Immigrants | Europe | 2.1 /100 | #240 | Tragic 53.2% |
| Immigrants | Sierra Leone | 2.1 /100 | #241 | Tragic 53.2% |
| Immigrants | Eastern Asia | 2.1 /100 | #242 | Tragic 53.2% |
| Ethiopians | 1.7 /100 | #243 | Tragic 53.1% |
| Indians (Asian) | 1.7 /100 | #244 | Tragic 53.1% |
| Immigrants | Ethiopia | 1.5 /100 | #245 | Tragic 53.0% |
| Immigrants | Nigeria | 1.2 /100 | #246 | Tragic 52.9% |
| Sierra Leoneans | 1.2 /100 | #247 | Tragic 52.9% |
| Colombians | 1.1 /100 | #248 | Tragic 52.9% |
| Immigrants | Brazil | 1.0 /100 | #249 | Tragic 52.8% |
| Mongolians | 1.0 /100 | #250 | Tragic 52.8% |
| Immigrants | Sudan | 1.0 /100 | #251 | Tragic 52.8% |
| Immigrants | Portugal | 1.0 /100 | #252 | Tragic 52.8% |
| Nigerians | 0.9 /100 | #253 | Tragic 52.8% |
Demographics Similar to Lebanese by 2 or more Vehicles in Household
In terms of 2 or more vehicles in household, the demographic groups most similar to Lebanese are Fijian (57.6%, a difference of 0.050%), Immigrants from Bolivia (57.6%, a difference of 0.050%), Jordanian (57.6%, a difference of 0.050%), Immigrants from Indonesia (57.6%, a difference of 0.050%), and Immigrants from Korea (57.6%, a difference of 0.050%).
| Demographics | Rating | Rank | 2 or more Vehicles in Household |
| Filipinos | 98.9 /100 | #94 | Exceptional 57.8% |
| Hmong | 98.9 /100 | #95 | Exceptional 57.8% |
| Burmese | 98.8 /100 | #96 | Exceptional 57.8% |
| Slavs | 98.8 /100 | #97 | Exceptional 57.8% |
| Palestinians | 98.6 /100 | #98 | Exceptional 57.7% |
| Cajuns | 98.5 /100 | #99 | Exceptional 57.7% |
| Fijians | 98.4 /100 | #100 | Exceptional 57.6% |
| Lebanese | 98.3 /100 | #101 | Exceptional 57.6% |
| Immigrants | Bolivia | 98.2 /100 | #102 | Exceptional 57.6% |
| Jordanians | 98.2 /100 | #103 | Exceptional 57.6% |
| Immigrants | Indonesia | 98.2 /100 | #104 | Exceptional 57.6% |
| Immigrants | Korea | 98.2 /100 | #105 | Exceptional 57.6% |
| Immigrants | Oceania | 98.2 /100 | #106 | Exceptional 57.5% |
| Immigrants | Netherlands | 98.2 /100 | #107 | Exceptional 57.5% |
| Immigrants | Canada | 98.1 /100 | #108 | Exceptional 57.5% |