Hmong vs Immigrants from Senegal 3 or more Vehicles in Household
COMPARE
Hmong
Immigrants from Senegal
3 or more Vehicles in Household
3 or more Vehicles in Household Comparison
Hmong
Immigrants from Senegal
21.0%
3 OR MORE VEHICLES IN HOUSEHOLD
98.2/ 100
METRIC RATING
98th/ 347
METRIC RANK
13.8%
3 OR MORE VEHICLES IN HOUSEHOLD
0.0/ 100
METRIC RATING
329th/ 347
METRIC RANK
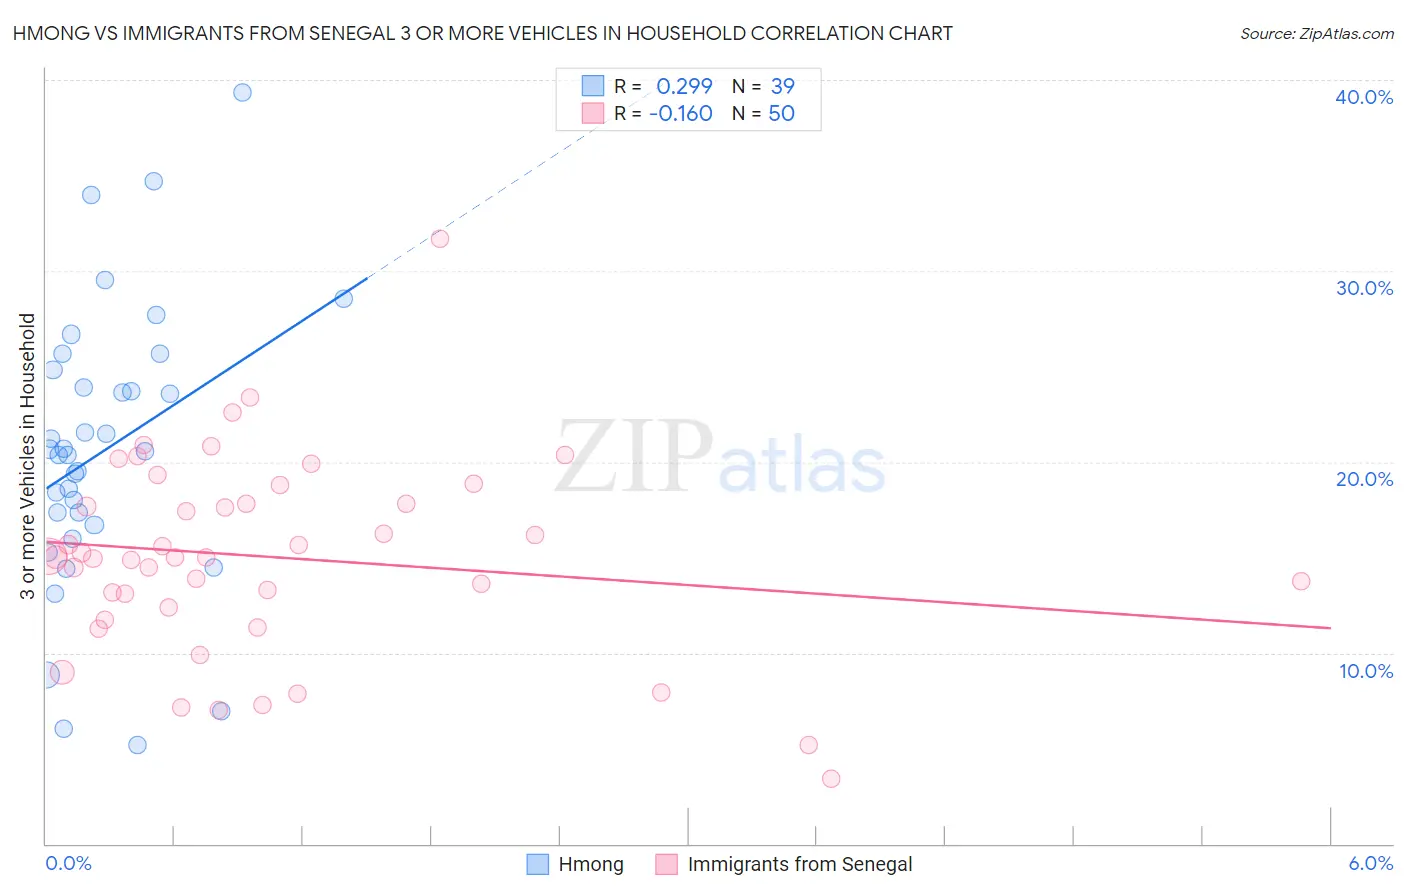
Hmong vs Immigrants from Senegal 3 or more Vehicles in Household Correlation Chart
The statistical analysis conducted on geographies consisting of 24,678,157 people shows a weak positive correlation between the proportion of Hmong and percentage of households with 3 or more vehicles available in the United States with a correlation coefficient (R) of 0.299 and weighted average of 21.0%. Similarly, the statistical analysis conducted on geographies consisting of 90,108,682 people shows a poor negative correlation between the proportion of Immigrants from Senegal and percentage of households with 3 or more vehicles available in the United States with a correlation coefficient (R) of -0.160 and weighted average of 13.8%, a difference of 52.1%.
3 or more Vehicles in Household Correlation Summary
| Measurement | Hmong | Immigrants from Senegal |
| Minimum | 5.2% | 3.4% |
| Maximum | 39.3% | 31.7% |
| Range | 34.1% | 28.3% |
| Mean | 20.6% | 15.0% |
| Median | 20.6% | 15.0% |
| Interquartile 25% (IQ1) | 16.7% | 12.4% |
| Interquartile 75% (IQ3) | 24.8% | 17.8% |
| Interquartile Range (IQR) | 8.1% | 5.4% |
| Standard Deviation (Sample) | 7.4% | 5.2% |
| Standard Deviation (Population) | 7.3% | 5.1% |
Similar Demographics by 3 or more Vehicles in Household
Demographics Similar to Hmong by 3 or more Vehicles in Household
In terms of 3 or more vehicles in household, the demographic groups most similar to Hmong are Alaska Native (21.0%, a difference of 0.0%), Comanche (21.0%, a difference of 0.040%), Canadian (21.0%, a difference of 0.060%), Cree (21.0%, a difference of 0.16%), and Pakistani (21.0%, a difference of 0.26%).
| Demographics | Rating | Rank | 3 or more Vehicles in Household |
| Belgians | 98.9 /100 | #91 | Exceptional 21.2% |
| Apache | 98.9 /100 | #92 | Exceptional 21.2% |
| Immigrants | Indonesia | 98.8 /100 | #93 | Exceptional 21.1% |
| Immigrants | Cambodia | 98.6 /100 | #94 | Exceptional 21.1% |
| Pakistanis | 98.5 /100 | #95 | Exceptional 21.0% |
| Cree | 98.4 /100 | #96 | Exceptional 21.0% |
| Canadians | 98.3 /100 | #97 | Exceptional 21.0% |
| Hmong | 98.2 /100 | #98 | Exceptional 21.0% |
| Alaska Natives | 98.2 /100 | #99 | Exceptional 21.0% |
| Comanche | 98.2 /100 | #100 | Exceptional 21.0% |
| Blackfeet | 97.9 /100 | #101 | Exceptional 20.9% |
| Seminole | 97.8 /100 | #102 | Exceptional 20.9% |
| Dutch West Indians | 97.8 /100 | #103 | Exceptional 20.9% |
| Luxembourgers | 97.7 /100 | #104 | Exceptional 20.9% |
| Austrians | 97.5 /100 | #105 | Exceptional 20.9% |
Demographics Similar to Immigrants from Senegal by 3 or more Vehicles in Household
In terms of 3 or more vehicles in household, the demographic groups most similar to Immigrants from Senegal are West Indian (13.7%, a difference of 0.33%), Immigrants from Dominica (13.7%, a difference of 0.55%), Immigrants from Albania (14.0%, a difference of 1.2%), Trinidadian and Tobagonian (13.6%, a difference of 1.3%), and Immigrants from Cabo Verde (13.6%, a difference of 1.6%).
| Demographics | Rating | Rank | 3 or more Vehicles in Household |
| Immigrants | West Indies | 0.0 /100 | #322 | Tragic 14.6% |
| Immigrants | Caribbean | 0.0 /100 | #323 | Tragic 14.6% |
| Immigrants | Yemen | 0.0 /100 | #324 | Tragic 14.2% |
| Senegalese | 0.0 /100 | #325 | Tragic 14.2% |
| Soviet Union | 0.0 /100 | #326 | Tragic 14.2% |
| Ecuadorians | 0.0 /100 | #327 | Tragic 14.1% |
| Immigrants | Albania | 0.0 /100 | #328 | Tragic 14.0% |
| Immigrants | Senegal | 0.0 /100 | #329 | Tragic 13.8% |
| West Indians | 0.0 /100 | #330 | Tragic 13.7% |
| Immigrants | Dominica | 0.0 /100 | #331 | Tragic 13.7% |
| Trinidadians and Tobagonians | 0.0 /100 | #332 | Tragic 13.6% |
| Immigrants | Cabo Verde | 0.0 /100 | #333 | Tragic 13.6% |
| Immigrants | Ecuador | 0.0 /100 | #334 | Tragic 13.4% |
| Immigrants | Trinidad and Tobago | 0.0 /100 | #335 | Tragic 13.3% |
| Barbadians | 0.0 /100 | #336 | Tragic 12.6% |