Pennsylvania German vs Immigrants from Senegal 3 or more Vehicles in Household
COMPARE
Pennsylvania German
Immigrants from Senegal
3 or more Vehicles in Household
3 or more Vehicles in Household Comparison
Pennsylvania Germans
Immigrants from Senegal
22.3%
3 OR MORE VEHICLES IN HOUSEHOLD
100.0/ 100
METRIC RATING
57th/ 347
METRIC RANK
13.8%
3 OR MORE VEHICLES IN HOUSEHOLD
0.0/ 100
METRIC RATING
329th/ 347
METRIC RANK
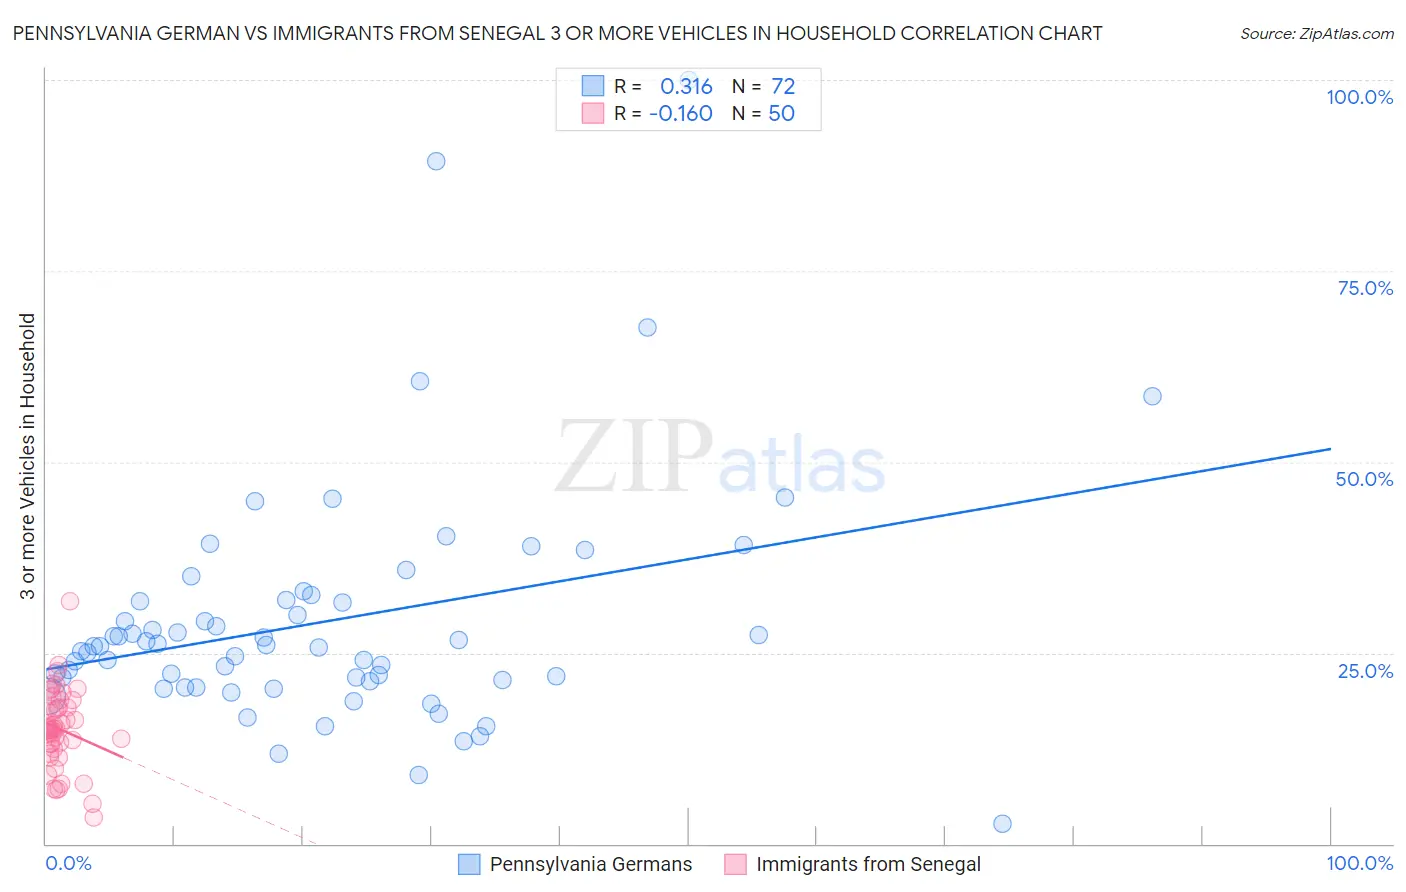
Pennsylvania German vs Immigrants from Senegal 3 or more Vehicles in Household Correlation Chart
The statistical analysis conducted on geographies consisting of 234,054,154 people shows a mild positive correlation between the proportion of Pennsylvania Germans and percentage of households with 3 or more vehicles available in the United States with a correlation coefficient (R) of 0.316 and weighted average of 22.3%. Similarly, the statistical analysis conducted on geographies consisting of 90,108,682 people shows a poor negative correlation between the proportion of Immigrants from Senegal and percentage of households with 3 or more vehicles available in the United States with a correlation coefficient (R) of -0.160 and weighted average of 13.8%, a difference of 62.0%.
3 or more Vehicles in Household Correlation Summary
| Measurement | Pennsylvania German | Immigrants from Senegal |
| Minimum | 2.6% | 3.4% |
| Maximum | 100.0% | 31.7% |
| Range | 97.4% | 28.3% |
| Mean | 29.1% | 15.0% |
| Median | 25.9% | 15.0% |
| Interquartile 25% (IQ1) | 21.4% | 12.4% |
| Interquartile 75% (IQ3) | 31.8% | 17.8% |
| Interquartile Range (IQR) | 10.4% | 5.4% |
| Standard Deviation (Sample) | 15.7% | 5.2% |
| Standard Deviation (Population) | 15.6% | 5.1% |
Similar Demographics by 3 or more Vehicles in Household
Demographics Similar to Pennsylvania Germans by 3 or more Vehicles in Household
In terms of 3 or more vehicles in household, the demographic groups most similar to Pennsylvania Germans are Spaniard (22.3%, a difference of 0.13%), Hispanic or Latino (22.4%, a difference of 0.16%), Immigrants from Laos (22.4%, a difference of 0.18%), Navajo (22.3%, a difference of 0.19%), and Finnish (22.3%, a difference of 0.28%).
| Demographics | Rating | Rank | 3 or more Vehicles in Household |
| Sioux | 100.0 /100 | #50 | Exceptional 22.6% |
| Whites/Caucasians | 100.0 /100 | #51 | Exceptional 22.6% |
| Welsh | 100.0 /100 | #52 | Exceptional 22.6% |
| Czechs | 100.0 /100 | #53 | Exceptional 22.5% |
| Crow | 100.0 /100 | #54 | Exceptional 22.5% |
| Immigrants | Laos | 100.0 /100 | #55 | Exceptional 22.4% |
| Hispanics or Latinos | 100.0 /100 | #56 | Exceptional 22.4% |
| Pennsylvania Germans | 100.0 /100 | #57 | Exceptional 22.3% |
| Spaniards | 100.0 /100 | #58 | Exceptional 22.3% |
| Navajo | 100.0 /100 | #59 | Exceptional 22.3% |
| Finns | 99.9 /100 | #60 | Exceptional 22.3% |
| Bhutanese | 99.9 /100 | #61 | Exceptional 22.2% |
| Fijians | 99.9 /100 | #62 | Exceptional 22.2% |
| Chickasaw | 99.9 /100 | #63 | Exceptional 22.2% |
| Immigrants | Taiwan | 99.9 /100 | #64 | Exceptional 22.1% |
Demographics Similar to Immigrants from Senegal by 3 or more Vehicles in Household
In terms of 3 or more vehicles in household, the demographic groups most similar to Immigrants from Senegal are West Indian (13.7%, a difference of 0.33%), Immigrants from Dominica (13.7%, a difference of 0.55%), Immigrants from Albania (14.0%, a difference of 1.2%), Trinidadian and Tobagonian (13.6%, a difference of 1.3%), and Immigrants from Cabo Verde (13.6%, a difference of 1.6%).
| Demographics | Rating | Rank | 3 or more Vehicles in Household |
| Immigrants | West Indies | 0.0 /100 | #322 | Tragic 14.6% |
| Immigrants | Caribbean | 0.0 /100 | #323 | Tragic 14.6% |
| Immigrants | Yemen | 0.0 /100 | #324 | Tragic 14.2% |
| Senegalese | 0.0 /100 | #325 | Tragic 14.2% |
| Soviet Union | 0.0 /100 | #326 | Tragic 14.2% |
| Ecuadorians | 0.0 /100 | #327 | Tragic 14.1% |
| Immigrants | Albania | 0.0 /100 | #328 | Tragic 14.0% |
| Immigrants | Senegal | 0.0 /100 | #329 | Tragic 13.8% |
| West Indians | 0.0 /100 | #330 | Tragic 13.7% |
| Immigrants | Dominica | 0.0 /100 | #331 | Tragic 13.7% |
| Trinidadians and Tobagonians | 0.0 /100 | #332 | Tragic 13.6% |
| Immigrants | Cabo Verde | 0.0 /100 | #333 | Tragic 13.6% |
| Immigrants | Ecuador | 0.0 /100 | #334 | Tragic 13.4% |
| Immigrants | Trinidad and Tobago | 0.0 /100 | #335 | Tragic 13.3% |
| Barbadians | 0.0 /100 | #336 | Tragic 12.6% |