Immigrants from Ireland vs Immigrants from Senegal 3 or more Vehicles in Household
COMPARE
Immigrants from Ireland
Immigrants from Senegal
3 or more Vehicles in Household
3 or more Vehicles in Household Comparison
Immigrants from Ireland
Immigrants from Senegal
17.3%
3 OR MORE VEHICLES IN HOUSEHOLD
0.3/ 100
METRIC RATING
282nd/ 347
METRIC RANK
13.8%
3 OR MORE VEHICLES IN HOUSEHOLD
0.0/ 100
METRIC RATING
329th/ 347
METRIC RANK
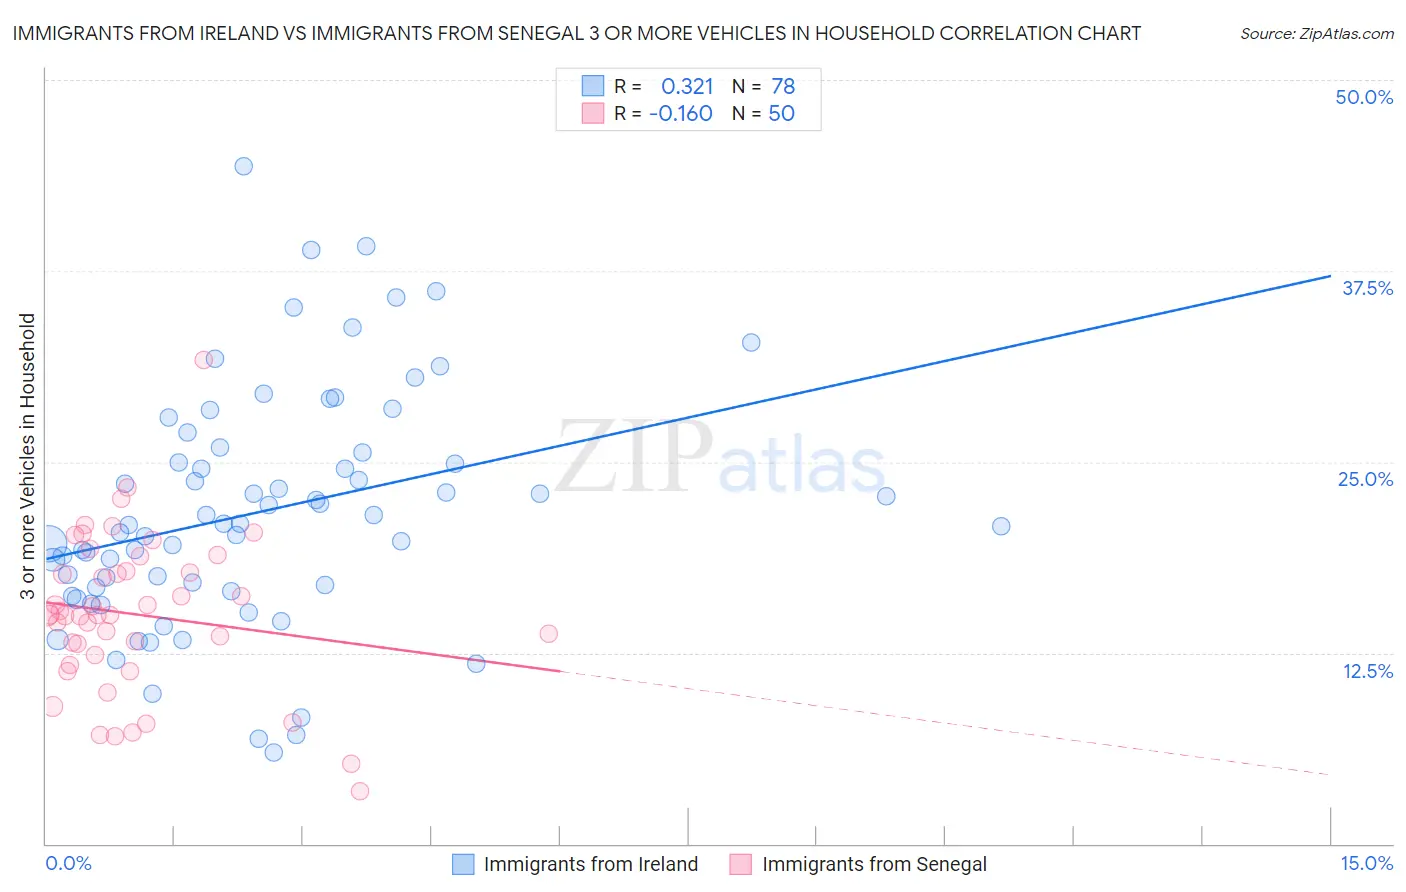
Immigrants from Ireland vs Immigrants from Senegal 3 or more Vehicles in Household Correlation Chart
The statistical analysis conducted on geographies consisting of 240,727,635 people shows a mild positive correlation between the proportion of Immigrants from Ireland and percentage of households with 3 or more vehicles available in the United States with a correlation coefficient (R) of 0.321 and weighted average of 17.3%. Similarly, the statistical analysis conducted on geographies consisting of 90,108,682 people shows a poor negative correlation between the proportion of Immigrants from Senegal and percentage of households with 3 or more vehicles available in the United States with a correlation coefficient (R) of -0.160 and weighted average of 13.8%, a difference of 25.7%.
3 or more Vehicles in Household Correlation Summary
| Measurement | Immigrants from Ireland | Immigrants from Senegal |
| Minimum | 6.0% | 3.4% |
| Maximum | 44.3% | 31.7% |
| Range | 38.3% | 28.3% |
| Mean | 21.7% | 15.0% |
| Median | 20.9% | 15.0% |
| Interquartile 25% (IQ1) | 16.8% | 12.4% |
| Interquartile 75% (IQ3) | 25.6% | 17.8% |
| Interquartile Range (IQR) | 8.8% | 5.4% |
| Standard Deviation (Sample) | 7.8% | 5.2% |
| Standard Deviation (Population) | 7.7% | 5.1% |
Similar Demographics by 3 or more Vehicles in Household
Demographics Similar to Immigrants from Ireland by 3 or more Vehicles in Household
In terms of 3 or more vehicles in household, the demographic groups most similar to Immigrants from Ireland are Black/African American (17.3%, a difference of 0.050%), Immigrants from Colombia (17.3%, a difference of 0.17%), Immigrants from Latvia (17.4%, a difference of 0.29%), Immigrants from Eastern Europe (17.4%, a difference of 0.33%), and Immigrants from Kazakhstan (17.4%, a difference of 0.37%).
| Demographics | Rating | Rank | 3 or more Vehicles in Household |
| Immigrants | Ukraine | 0.4 /100 | #275 | Tragic 17.5% |
| Okinawans | 0.4 /100 | #276 | Tragic 17.4% |
| Brazilians | 0.4 /100 | #277 | Tragic 17.4% |
| Immigrants | Bahamas | 0.3 /100 | #278 | Tragic 17.4% |
| Immigrants | Kazakhstan | 0.3 /100 | #279 | Tragic 17.4% |
| Immigrants | Eastern Europe | 0.3 /100 | #280 | Tragic 17.4% |
| Immigrants | Latvia | 0.3 /100 | #281 | Tragic 17.4% |
| Immigrants | Ireland | 0.3 /100 | #282 | Tragic 17.3% |
| Blacks/African Americans | 0.3 /100 | #283 | Tragic 17.3% |
| Immigrants | Colombia | 0.3 /100 | #284 | Tragic 17.3% |
| Immigrants | Croatia | 0.2 /100 | #285 | Tragic 17.2% |
| Menominee | 0.2 /100 | #286 | Tragic 17.2% |
| Immigrants | Brazil | 0.2 /100 | #287 | Tragic 17.1% |
| Immigrants | Uruguay | 0.2 /100 | #288 | Tragic 17.1% |
| Immigrants | Liberia | 0.1 /100 | #289 | Tragic 17.1% |
Demographics Similar to Immigrants from Senegal by 3 or more Vehicles in Household
In terms of 3 or more vehicles in household, the demographic groups most similar to Immigrants from Senegal are West Indian (13.7%, a difference of 0.33%), Immigrants from Dominica (13.7%, a difference of 0.55%), Immigrants from Albania (14.0%, a difference of 1.2%), Trinidadian and Tobagonian (13.6%, a difference of 1.3%), and Immigrants from Cabo Verde (13.6%, a difference of 1.6%).
| Demographics | Rating | Rank | 3 or more Vehicles in Household |
| Immigrants | West Indies | 0.0 /100 | #322 | Tragic 14.6% |
| Immigrants | Caribbean | 0.0 /100 | #323 | Tragic 14.6% |
| Immigrants | Yemen | 0.0 /100 | #324 | Tragic 14.2% |
| Senegalese | 0.0 /100 | #325 | Tragic 14.2% |
| Soviet Union | 0.0 /100 | #326 | Tragic 14.2% |
| Ecuadorians | 0.0 /100 | #327 | Tragic 14.1% |
| Immigrants | Albania | 0.0 /100 | #328 | Tragic 14.0% |
| Immigrants | Senegal | 0.0 /100 | #329 | Tragic 13.8% |
| West Indians | 0.0 /100 | #330 | Tragic 13.7% |
| Immigrants | Dominica | 0.0 /100 | #331 | Tragic 13.7% |
| Trinidadians and Tobagonians | 0.0 /100 | #332 | Tragic 13.6% |
| Immigrants | Cabo Verde | 0.0 /100 | #333 | Tragic 13.6% |
| Immigrants | Ecuador | 0.0 /100 | #334 | Tragic 13.4% |
| Immigrants | Trinidad and Tobago | 0.0 /100 | #335 | Tragic 13.3% |
| Barbadians | 0.0 /100 | #336 | Tragic 12.6% |