Immigrants from Bahamas vs Guatemalan 3 or more Vehicles in Household
COMPARE
Immigrants from Bahamas
Guatemalan
3 or more Vehicles in Household
3 or more Vehicles in Household Comparison
Immigrants from Bahamas
Guatemalans
17.4%
3 OR MORE VEHICLES IN HOUSEHOLD
0.3/ 100
METRIC RATING
278th/ 347
METRIC RANK
20.1%
3 OR MORE VEHICLES IN HOUSEHOLD
82.6/ 100
METRIC RATING
148th/ 347
METRIC RANK
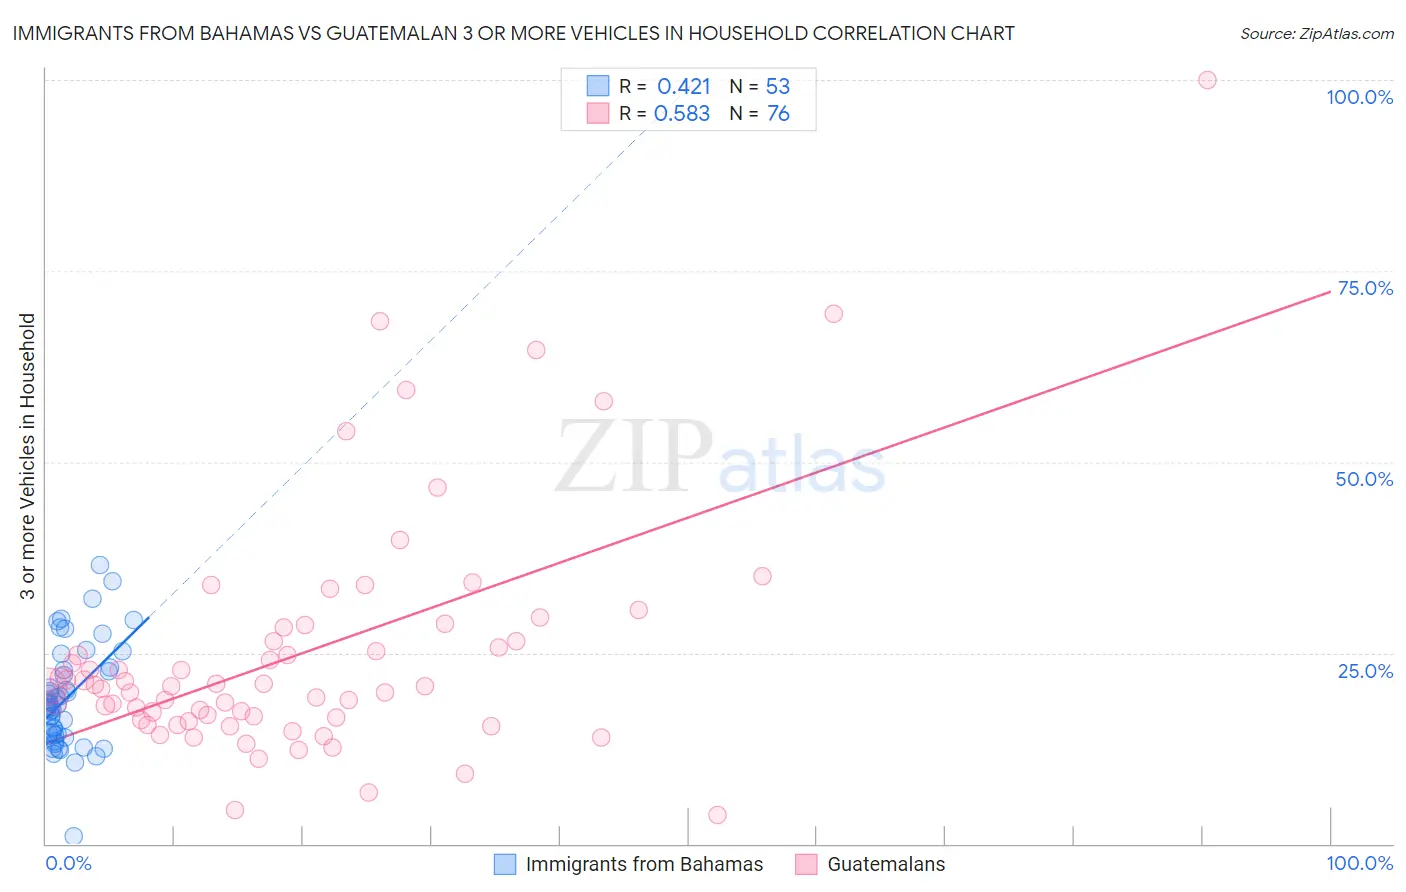
Immigrants from Bahamas vs Guatemalan 3 or more Vehicles in Household Correlation Chart
The statistical analysis conducted on geographies consisting of 104,594,814 people shows a moderate positive correlation between the proportion of Immigrants from Bahamas and percentage of households with 3 or more vehicles available in the United States with a correlation coefficient (R) of 0.421 and weighted average of 17.4%. Similarly, the statistical analysis conducted on geographies consisting of 409,244,641 people shows a substantial positive correlation between the proportion of Guatemalans and percentage of households with 3 or more vehicles available in the United States with a correlation coefficient (R) of 0.583 and weighted average of 20.1%, a difference of 15.3%.
3 or more Vehicles in Household Correlation Summary
| Measurement | Immigrants from Bahamas | Guatemalan |
| Minimum | 1.0% | 3.8% |
| Maximum | 36.4% | 100.0% |
| Range | 35.4% | 96.2% |
| Mean | 19.2% | 25.1% |
| Median | 18.2% | 20.6% |
| Interquartile 25% (IQ1) | 14.3% | 16.3% |
| Interquartile 75% (IQ3) | 22.9% | 27.4% |
| Interquartile Range (IQR) | 8.6% | 11.1% |
| Standard Deviation (Sample) | 6.8% | 16.1% |
| Standard Deviation (Population) | 6.7% | 16.0% |
Similar Demographics by 3 or more Vehicles in Household
Demographics Similar to Immigrants from Bahamas by 3 or more Vehicles in Household
In terms of 3 or more vehicles in household, the demographic groups most similar to Immigrants from Bahamas are Immigrants from Kazakhstan (17.4%, a difference of 0.010%), Immigrants from Eastern Europe (17.4%, a difference of 0.050%), Brazilian (17.4%, a difference of 0.090%), Immigrants from Latvia (17.4%, a difference of 0.10%), and Okinawan (17.4%, a difference of 0.23%).
| Demographics | Rating | Rank | 3 or more Vehicles in Household |
| South Americans | 0.6 /100 | #271 | Tragic 17.6% |
| Immigrants | Africa | 0.5 /100 | #272 | Tragic 17.6% |
| Immigrants | Sudan | 0.5 /100 | #273 | Tragic 17.6% |
| Immigrants | Bosnia and Herzegovina | 0.5 /100 | #274 | Tragic 17.5% |
| Immigrants | Ukraine | 0.4 /100 | #275 | Tragic 17.5% |
| Okinawans | 0.4 /100 | #276 | Tragic 17.4% |
| Brazilians | 0.4 /100 | #277 | Tragic 17.4% |
| Immigrants | Bahamas | 0.3 /100 | #278 | Tragic 17.4% |
| Immigrants | Kazakhstan | 0.3 /100 | #279 | Tragic 17.4% |
| Immigrants | Eastern Europe | 0.3 /100 | #280 | Tragic 17.4% |
| Immigrants | Latvia | 0.3 /100 | #281 | Tragic 17.4% |
| Immigrants | Ireland | 0.3 /100 | #282 | Tragic 17.3% |
| Blacks/African Americans | 0.3 /100 | #283 | Tragic 17.3% |
| Immigrants | Colombia | 0.3 /100 | #284 | Tragic 17.3% |
| Immigrants | Croatia | 0.2 /100 | #285 | Tragic 17.2% |
Demographics Similar to Guatemalans by 3 or more Vehicles in Household
In terms of 3 or more vehicles in household, the demographic groups most similar to Guatemalans are Slovak (20.1%, a difference of 0.060%), Australian (20.1%, a difference of 0.14%), Palestinian (20.1%, a difference of 0.18%), Iranian (20.1%, a difference of 0.19%), and Immigrants from Iran (20.0%, a difference of 0.20%).
| Demographics | Rating | Rank | 3 or more Vehicles in Household |
| Ottawa | 84.9 /100 | #141 | Excellent 20.1% |
| Jordanians | 84.4 /100 | #142 | Excellent 20.1% |
| Lithuanians | 84.4 /100 | #143 | Excellent 20.1% |
| Iranians | 84.0 /100 | #144 | Excellent 20.1% |
| Palestinians | 83.9 /100 | #145 | Excellent 20.1% |
| Australians | 83.6 /100 | #146 | Excellent 20.1% |
| Slovaks | 83.0 /100 | #147 | Excellent 20.1% |
| Guatemalans | 82.6 /100 | #148 | Excellent 20.1% |
| Immigrants | Iran | 80.9 /100 | #149 | Excellent 20.0% |
| Immigrants | Immigrants | 80.8 /100 | #150 | Excellent 20.0% |
| Taiwanese | 80.6 /100 | #151 | Excellent 20.0% |
| Lebanese | 79.8 /100 | #152 | Good 20.0% |
| Yuman | 75.6 /100 | #153 | Good 19.9% |
| Immigrants | Jordan | 75.0 /100 | #154 | Good 19.9% |
| Tlingit-Haida | 73.4 /100 | #155 | Good 19.9% |