Immigrants from Liberia vs Guatemalan Disability Age 5 to 17
COMPARE
Immigrants from Liberia
Guatemalan
Disability Age 5 to 17
Disability Age 5 to 17 Comparison
Immigrants from Liberia
Guatemalans
6.1%
DISABILITY AGE 5 TO 17
0.1/ 100
METRIC RATING
278th/ 347
METRIC RANK
5.5%
DISABILITY AGE 5 TO 17
81.5/ 100
METRIC RATING
150th/ 347
METRIC RANK
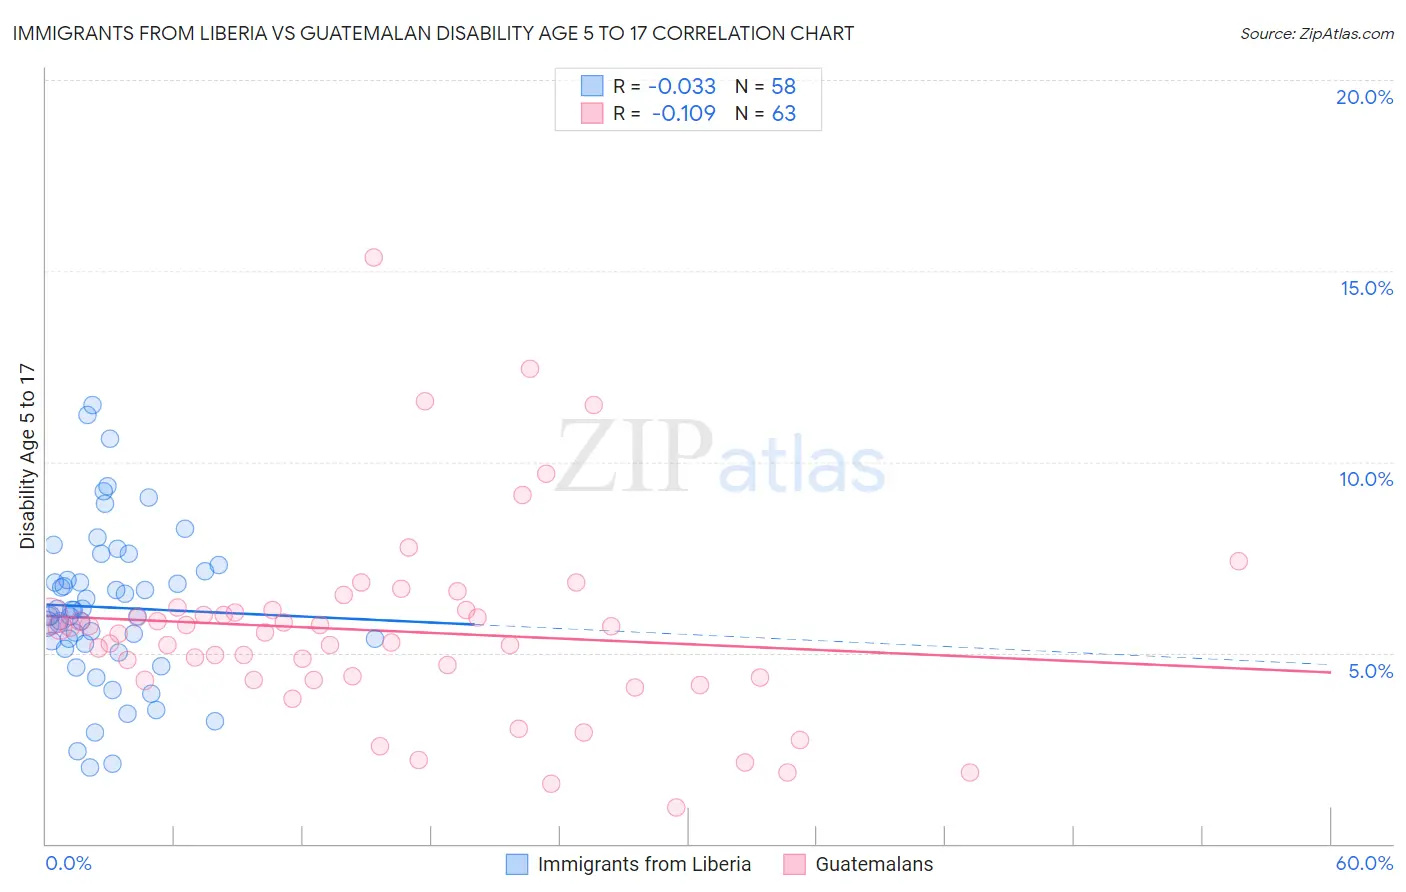
Immigrants from Liberia vs Guatemalan Disability Age 5 to 17 Correlation Chart
The statistical analysis conducted on geographies consisting of 135,071,303 people shows no correlation between the proportion of Immigrants from Liberia and percentage of population with a disability between the ages 5 and 17 in the United States with a correlation coefficient (R) of -0.033 and weighted average of 6.1%. Similarly, the statistical analysis conducted on geographies consisting of 406,988,204 people shows a poor negative correlation between the proportion of Guatemalans and percentage of population with a disability between the ages 5 and 17 in the United States with a correlation coefficient (R) of -0.109 and weighted average of 5.5%, a difference of 11.0%.
Disability Age 5 to 17 Correlation Summary
| Measurement | Immigrants from Liberia | Guatemalan |
| Minimum | 2.0% | 0.96% |
| Maximum | 11.5% | 15.4% |
| Range | 9.5% | 14.4% |
| Mean | 6.2% | 5.6% |
| Median | 6.0% | 5.5% |
| Interquartile 25% (IQ1) | 5.3% | 4.3% |
| Interquartile 75% (IQ3) | 7.1% | 6.1% |
| Interquartile Range (IQR) | 1.9% | 1.8% |
| Standard Deviation (Sample) | 2.0% | 2.5% |
| Standard Deviation (Population) | 2.0% | 2.5% |
Similar Demographics by Disability Age 5 to 17
Demographics Similar to Immigrants from Liberia by Disability Age 5 to 17
In terms of disability age 5 to 17, the demographic groups most similar to Immigrants from Liberia are Puget Sound Salish (6.1%, a difference of 0.080%), Immigrants from Jamaica (6.1%, a difference of 0.14%), Portuguese (6.1%, a difference of 0.28%), Scottish (6.1%, a difference of 0.53%), and German (6.1%, a difference of 0.78%).
| Demographics | Rating | Rank | Disability Age 5 to 17 |
| Immigrants | Zaire | 0.2 /100 | #271 | Tragic 6.0% |
| Finns | 0.2 /100 | #272 | Tragic 6.0% |
| Alaska Natives | 0.2 /100 | #273 | Tragic 6.0% |
| Cheyenne | 0.2 /100 | #274 | Tragic 6.0% |
| Dutch | 0.2 /100 | #275 | Tragic 6.0% |
| Japanese | 0.1 /100 | #276 | Tragic 6.1% |
| Puget Sound Salish | 0.1 /100 | #277 | Tragic 6.1% |
| Immigrants | Liberia | 0.1 /100 | #278 | Tragic 6.1% |
| Immigrants | Jamaica | 0.1 /100 | #279 | Tragic 6.1% |
| Portuguese | 0.1 /100 | #280 | Tragic 6.1% |
| Scottish | 0.0 /100 | #281 | Tragic 6.1% |
| Germans | 0.0 /100 | #282 | Tragic 6.1% |
| Ugandans | 0.0 /100 | #283 | Tragic 6.2% |
| Sub-Saharan Africans | 0.0 /100 | #284 | Tragic 6.2% |
| English | 0.0 /100 | #285 | Tragic 6.2% |
Demographics Similar to Guatemalans by Disability Age 5 to 17
In terms of disability age 5 to 17, the demographic groups most similar to Guatemalans are Central American (5.5%, a difference of 0.0%), Samoan (5.5%, a difference of 0.030%), Estonian (5.5%, a difference of 0.060%), Ute (5.5%, a difference of 0.070%), and Immigrants from Albania (5.5%, a difference of 0.13%).
| Demographics | Rating | Rank | Disability Age 5 to 17 |
| Immigrants | Hungary | 87.9 /100 | #143 | Excellent 5.5% |
| Pakistanis | 87.3 /100 | #144 | Excellent 5.5% |
| Immigrants | Guatemala | 86.6 /100 | #145 | Excellent 5.5% |
| Albanians | 83.7 /100 | #146 | Excellent 5.5% |
| Immigrants | Albania | 83.1 /100 | #147 | Excellent 5.5% |
| Samoans | 81.9 /100 | #148 | Excellent 5.5% |
| Central Americans | 81.6 /100 | #149 | Excellent 5.5% |
| Guatemalans | 81.5 /100 | #150 | Excellent 5.5% |
| Estonians | 80.8 /100 | #151 | Excellent 5.5% |
| Ute | 80.6 /100 | #152 | Excellent 5.5% |
| Ecuadorians | 79.7 /100 | #153 | Good 5.5% |
| Australians | 78.8 /100 | #154 | Good 5.5% |
| Immigrants | Ecuador | 78.3 /100 | #155 | Good 5.5% |
| Hawaiians | 78.0 /100 | #156 | Good 5.5% |
| Immigrants | Costa Rica | 77.9 /100 | #157 | Good 5.5% |