Immigrants from Liberia vs Guatemalan Hearing Disability
COMPARE
Immigrants from Liberia
Guatemalan
Hearing Disability
Hearing Disability Comparison
Immigrants from Liberia
Guatemalans
2.8%
HEARING DISABILITY
90.0/ 100
METRIC RATING
117th/ 347
METRIC RANK
2.8%
HEARING DISABILITY
93.2/ 100
METRIC RATING
108th/ 347
METRIC RANK
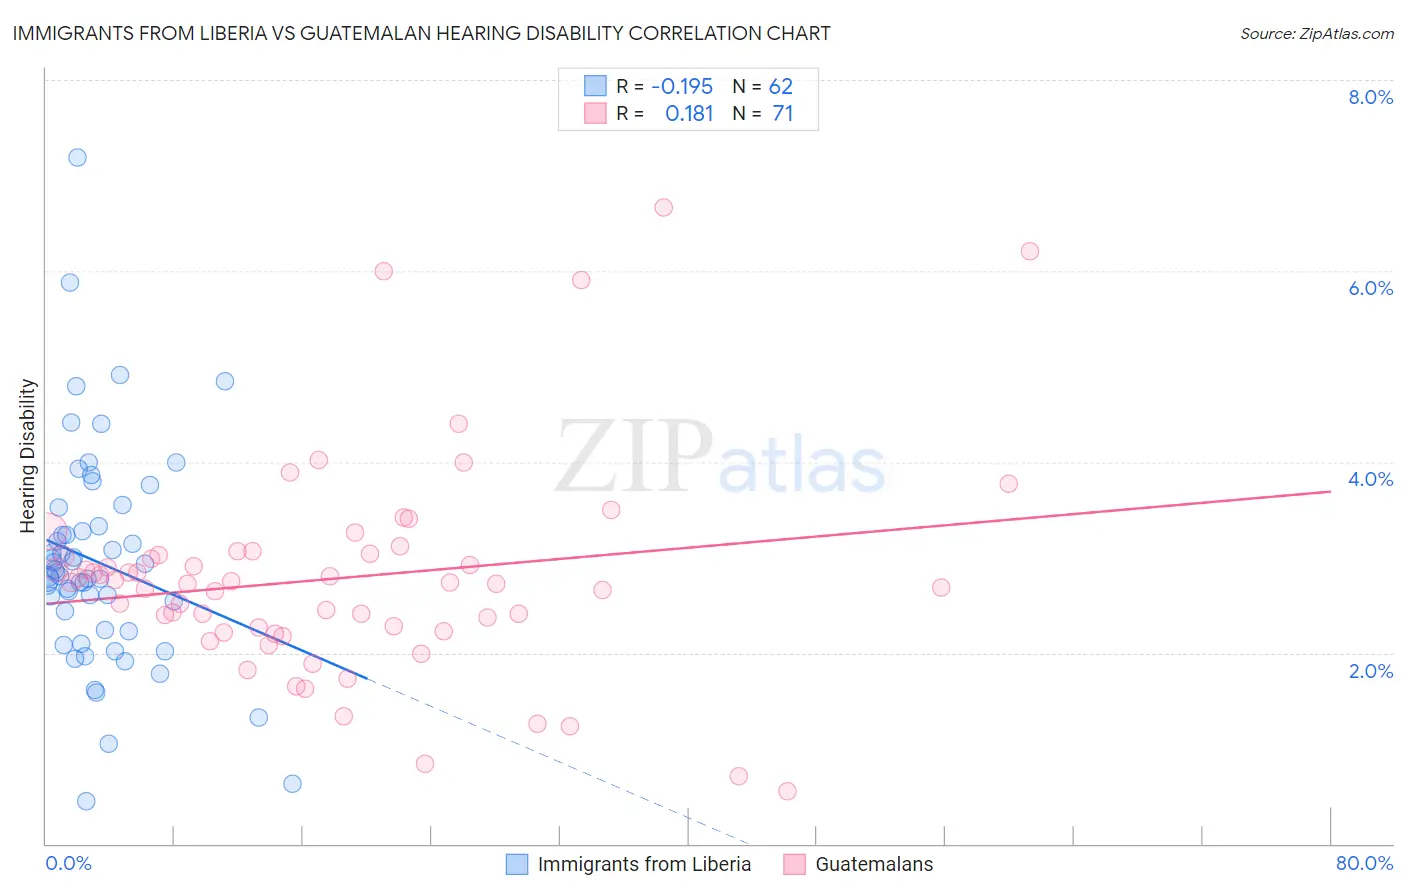
Immigrants from Liberia vs Guatemalan Hearing Disability Correlation Chart
The statistical analysis conducted on geographies consisting of 135,218,805 people shows a poor negative correlation between the proportion of Immigrants from Liberia and percentage of population with hearing disability in the United States with a correlation coefficient (R) of -0.195 and weighted average of 2.8%. Similarly, the statistical analysis conducted on geographies consisting of 409,374,057 people shows a poor positive correlation between the proportion of Guatemalans and percentage of population with hearing disability in the United States with a correlation coefficient (R) of 0.181 and weighted average of 2.8%, a difference of 1.1%.
Hearing Disability Correlation Summary
| Measurement | Immigrants from Liberia | Guatemalan |
| Minimum | 0.44% | 0.55% |
| Maximum | 7.2% | 6.7% |
| Range | 6.7% | 6.1% |
| Mean | 3.0% | 2.8% |
| Median | 2.8% | 2.7% |
| Interquartile 25% (IQ1) | 2.2% | 2.2% |
| Interquartile 75% (IQ3) | 3.3% | 3.0% |
| Interquartile Range (IQR) | 1.1% | 0.81% |
| Standard Deviation (Sample) | 1.1% | 1.1% |
| Standard Deviation (Population) | 1.1% | 1.1% |
Demographics Similar to Immigrants from Liberia and Guatemalans by Hearing Disability
In terms of hearing disability, the demographic groups most similar to Immigrants from Liberia are Zimbabwean (2.8%, a difference of 0.010%), Kenyan (2.8%, a difference of 0.030%), Immigrants (2.8%, a difference of 0.090%), Jordanian (2.8%, a difference of 0.13%), and Immigrants from Latin America (2.8%, a difference of 0.15%). Similarly, the demographic groups most similar to Guatemalans are Turkish (2.8%, a difference of 0.070%), Honduran (2.8%, a difference of 0.080%), Immigrants from Chile (2.8%, a difference of 0.080%), Cypriot (2.8%, a difference of 0.12%), and Immigrants from Yemen (2.8%, a difference of 0.17%).
| Demographics | Rating | Rank | Hearing Disability |
| Taiwanese | 94.8 /100 | #102 | Exceptional 2.8% |
| Immigrants | Indonesia | 94.7 /100 | #103 | Exceptional 2.8% |
| Burmese | 94.2 /100 | #104 | Exceptional 2.8% |
| Moroccans | 93.9 /100 | #105 | Exceptional 2.8% |
| Hondurans | 93.4 /100 | #106 | Exceptional 2.8% |
| Immigrants | Chile | 93.4 /100 | #107 | Exceptional 2.8% |
| Guatemalans | 93.2 /100 | #108 | Exceptional 2.8% |
| Turks | 93.0 /100 | #109 | Exceptional 2.8% |
| Cypriots | 92.9 /100 | #110 | Exceptional 2.8% |
| Immigrants | Yemen | 92.7 /100 | #111 | Exceptional 2.8% |
| U.S. Virgin Islanders | 92.5 /100 | #112 | Exceptional 2.8% |
| Immigrants | Belarus | 91.6 /100 | #113 | Exceptional 2.8% |
| Cambodians | 91.1 /100 | #114 | Exceptional 2.8% |
| Immigrants | Latin America | 90.5 /100 | #115 | Exceptional 2.8% |
| Immigrants | Immigrants | 90.3 /100 | #116 | Exceptional 2.8% |
| Immigrants | Liberia | 90.0 /100 | #117 | Excellent 2.8% |
| Zimbabweans | 89.9 /100 | #118 | Excellent 2.8% |
| Kenyans | 89.8 /100 | #119 | Excellent 2.8% |
| Jordanians | 89.5 /100 | #120 | Excellent 2.8% |
| Cubans | 89.4 /100 | #121 | Excellent 2.8% |
| Liberians | 89.0 /100 | #122 | Excellent 2.8% |