Bulgarian vs Immigrants from China 3 or more Vehicles in Household
COMPARE
Bulgarian
Immigrants from China
3 or more Vehicles in Household
3 or more Vehicles in Household Comparison
Bulgarians
Immigrants from China
18.8%
3 OR MORE VEHICLES IN HOUSEHOLD
13.1/ 100
METRIC RATING
210th/ 347
METRIC RANK
18.2%
3 OR MORE VEHICLES IN HOUSEHOLD
2.9/ 100
METRIC RATING
240th/ 347
METRIC RANK
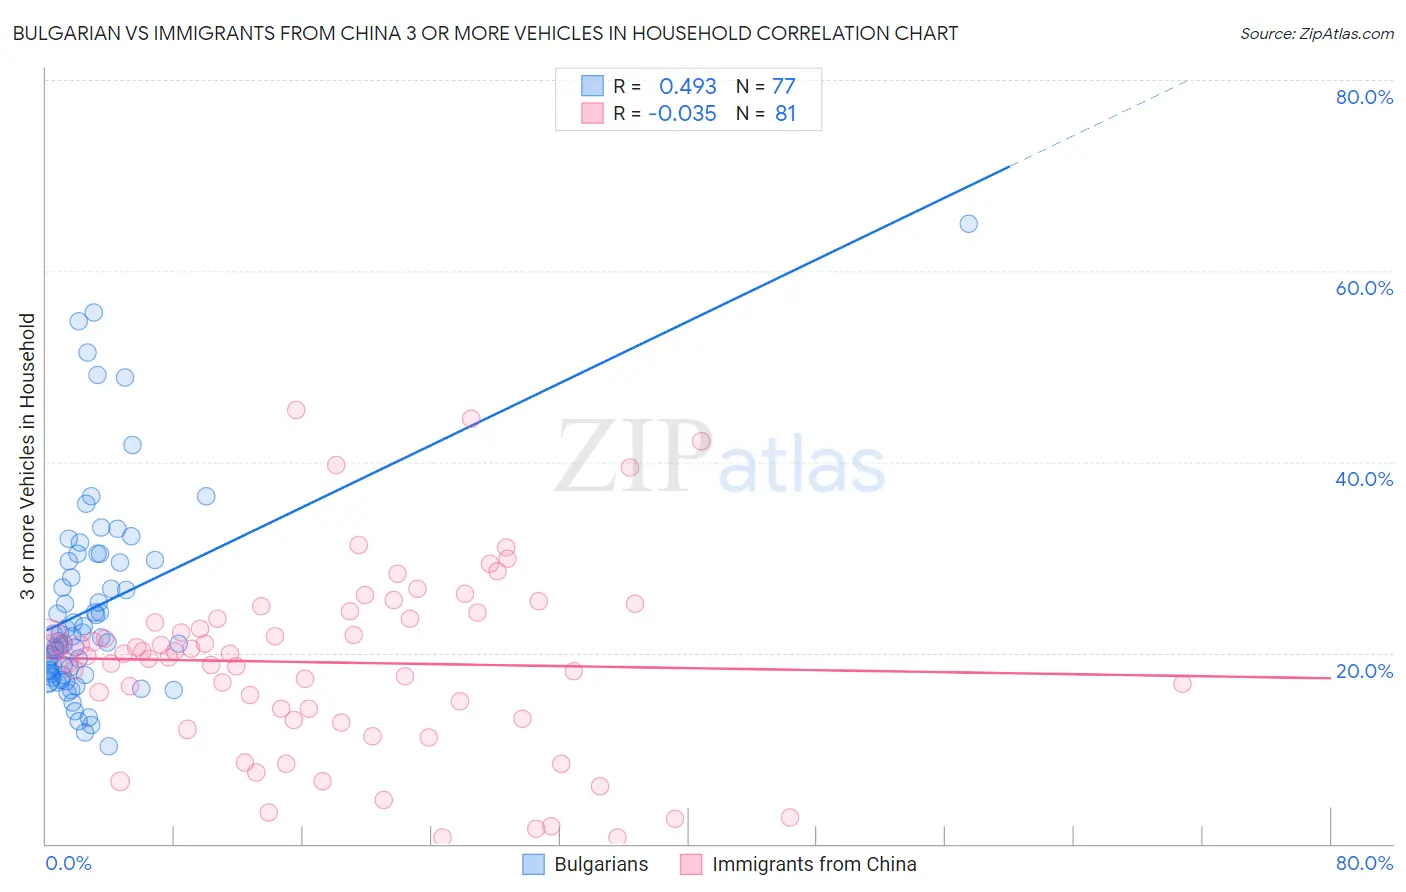
Bulgarian vs Immigrants from China 3 or more Vehicles in Household Correlation Chart
The statistical analysis conducted on geographies consisting of 205,529,669 people shows a moderate positive correlation between the proportion of Bulgarians and percentage of households with 3 or more vehicles available in the United States with a correlation coefficient (R) of 0.493 and weighted average of 18.8%. Similarly, the statistical analysis conducted on geographies consisting of 456,383,621 people shows no correlation between the proportion of Immigrants from China and percentage of households with 3 or more vehicles available in the United States with a correlation coefficient (R) of -0.035 and weighted average of 18.2%, a difference of 3.2%.
3 or more Vehicles in Household Correlation Summary
| Measurement | Bulgarian | Immigrants from China |
| Minimum | 10.2% | 0.62% |
| Maximum | 65.0% | 45.4% |
| Range | 54.8% | 44.8% |
| Mean | 24.8% | 19.0% |
| Median | 21.6% | 19.9% |
| Interquartile 25% (IQ1) | 17.6% | 13.0% |
| Interquartile 75% (IQ3) | 29.7% | 23.9% |
| Interquartile Range (IQR) | 12.0% | 10.9% |
| Standard Deviation (Sample) | 10.8% | 9.7% |
| Standard Deviation (Population) | 10.8% | 9.6% |
Similar Demographics by 3 or more Vehicles in Household
Demographics Similar to Bulgarians by 3 or more Vehicles in Household
In terms of 3 or more vehicles in household, the demographic groups most similar to Bulgarians are Immigrants from Egypt (18.8%, a difference of 0.080%), Immigrants from Burma/Myanmar (18.8%, a difference of 0.090%), Immigrants from Chile (18.8%, a difference of 0.10%), Immigrants from Kenya (18.8%, a difference of 0.12%), and Immigrants from Eastern Asia (18.8%, a difference of 0.17%).
| Demographics | Rating | Rank | 3 or more Vehicles in Household |
| Tohono O'odham | 14.8 /100 | #203 | Poor 18.9% |
| Immigrants | Romania | 14.6 /100 | #204 | Poor 18.9% |
| Russians | 14.2 /100 | #205 | Poor 18.8% |
| Immigrants | Eastern Asia | 14.1 /100 | #206 | Poor 18.8% |
| Immigrants | Chile | 13.6 /100 | #207 | Poor 18.8% |
| Immigrants | Burma/Myanmar | 13.6 /100 | #208 | Poor 18.8% |
| Immigrants | Egypt | 13.5 /100 | #209 | Poor 18.8% |
| Bulgarians | 13.1 /100 | #210 | Poor 18.8% |
| Immigrants | Kenya | 12.4 /100 | #211 | Poor 18.8% |
| Panamanians | 11.6 /100 | #212 | Poor 18.8% |
| Immigrants | Cuba | 11.6 /100 | #213 | Poor 18.8% |
| Immigrants | Sierra Leone | 10.8 /100 | #214 | Poor 18.7% |
| Eastern Europeans | 10.6 /100 | #215 | Poor 18.7% |
| Immigrants | Nigeria | 10.3 /100 | #216 | Poor 18.7% |
| Immigrants | Italy | 10.2 /100 | #217 | Poor 18.7% |
Demographics Similar to Immigrants from China by 3 or more Vehicles in Household
In terms of 3 or more vehicles in household, the demographic groups most similar to Immigrants from China are Immigrants from Honduras (18.2%, a difference of 0.13%), Immigrants from Middle Africa (18.2%, a difference of 0.13%), African (18.2%, a difference of 0.20%), Hopi (18.2%, a difference of 0.31%), and Indonesian (18.3%, a difference of 0.36%).
| Demographics | Rating | Rank | 3 or more Vehicles in Household |
| Hondurans | 4.6 /100 | #233 | Tragic 18.4% |
| Immigrants | North Macedonia | 4.4 /100 | #234 | Tragic 18.4% |
| Sierra Leoneans | 3.9 /100 | #235 | Tragic 18.3% |
| Immigrants | Malaysia | 3.6 /100 | #236 | Tragic 18.3% |
| Indonesians | 3.5 /100 | #237 | Tragic 18.3% |
| Immigrants | Honduras | 3.1 /100 | #238 | Tragic 18.2% |
| Immigrants | Middle Africa | 3.1 /100 | #239 | Tragic 18.2% |
| Immigrants | China | 2.9 /100 | #240 | Tragic 18.2% |
| Africans | 2.7 /100 | #241 | Tragic 18.2% |
| Hopi | 2.5 /100 | #242 | Tragic 18.2% |
| Immigrants | Europe | 2.4 /100 | #243 | Tragic 18.1% |
| Mongolians | 2.3 /100 | #244 | Tragic 18.1% |
| Immigrants | Belize | 2.1 /100 | #245 | Tragic 18.1% |
| Immigrants | Australia | 2.0 /100 | #246 | Tragic 18.1% |
| Carpatho Rusyns | 1.9 /100 | #247 | Tragic 18.0% |