Navajo vs Moroccan 2 or more Vehicles in Household
COMPARE
Navajo
Moroccan
2 or more Vehicles in Household
2 or more Vehicles in Household Comparison
Navajo
Moroccans
55.3%
2 OR MORE VEHICLES IN HOUSEHOLD
50.0/ 100
METRIC RATING
174th/ 347
METRIC RANK
48.8%
2 OR MORE VEHICLES IN HOUSEHOLD
0.0/ 100
METRIC RATING
309th/ 347
METRIC RANK
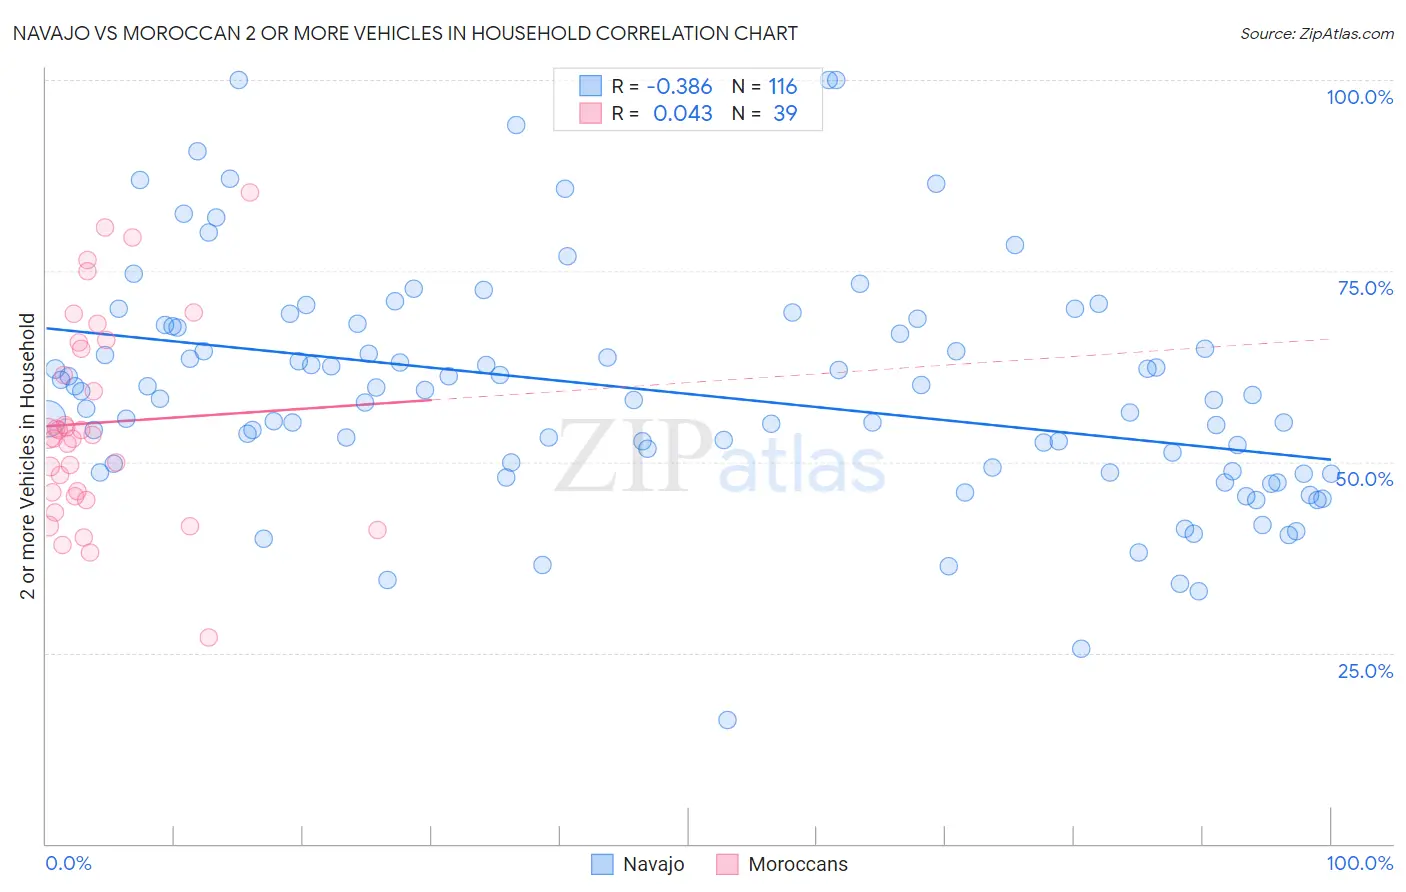
Navajo vs Moroccan 2 or more Vehicles in Household Correlation Chart
The statistical analysis conducted on geographies consisting of 224,763,782 people shows a mild negative correlation between the proportion of Navajo and percentage of households with 2 or more vehicles available in the United States with a correlation coefficient (R) of -0.386 and weighted average of 55.3%. Similarly, the statistical analysis conducted on geographies consisting of 201,766,092 people shows no correlation between the proportion of Moroccans and percentage of households with 2 or more vehicles available in the United States with a correlation coefficient (R) of 0.043 and weighted average of 48.8%, a difference of 13.4%.
2 or more Vehicles in Household Correlation Summary
| Measurement | Navajo | Moroccan |
| Minimum | 16.3% | 27.0% |
| Maximum | 100.0% | 85.3% |
| Range | 83.7% | 58.3% |
| Mean | 59.2% | 55.1% |
| Median | 58.5% | 53.5% |
| Interquartile 25% (IQ1) | 49.0% | 45.6% |
| Interquartile 75% (IQ3) | 67.7% | 65.6% |
| Interquartile Range (IQR) | 18.7% | 20.0% |
| Standard Deviation (Sample) | 15.1% | 13.3% |
| Standard Deviation (Population) | 15.1% | 13.1% |
Similar Demographics by 2 or more Vehicles in Household
Demographics Similar to Navajo by 2 or more Vehicles in Household
In terms of 2 or more vehicles in household, the demographic groups most similar to Navajo are Immigrants from Denmark (55.3%, a difference of 0.020%), Immigrants from Western Europe (55.4%, a difference of 0.050%), Immigrants from Nicaragua (55.4%, a difference of 0.070%), Immigrants from Cuba (55.3%, a difference of 0.12%), and Menominee (55.3%, a difference of 0.15%).
| Demographics | Rating | Rank | 2 or more Vehicles in Household |
| Kenyans | 58.1 /100 | #167 | Average 55.5% |
| French American Indians | 56.7 /100 | #168 | Average 55.5% |
| Immigrants | Austria | 56.3 /100 | #169 | Average 55.5% |
| Romanians | 55.8 /100 | #170 | Average 55.5% |
| Immigrants | Costa Rica | 54.4 /100 | #171 | Average 55.4% |
| Immigrants | Nicaragua | 51.6 /100 | #172 | Average 55.4% |
| Immigrants | Western Europe | 51.4 /100 | #173 | Average 55.4% |
| Navajo | 50.0 /100 | #174 | Average 55.3% |
| Immigrants | Denmark | 49.4 /100 | #175 | Average 55.3% |
| Immigrants | Cuba | 47.0 /100 | #176 | Average 55.3% |
| Menominee | 46.2 /100 | #177 | Average 55.3% |
| Immigrants | Sweden | 45.3 /100 | #178 | Average 55.2% |
| Alaskan Athabascans | 42.9 /100 | #179 | Average 55.2% |
| Immigrants | Kenya | 40.4 /100 | #180 | Average 55.1% |
| Immigrants | Micronesia | 38.2 /100 | #181 | Fair 55.1% |
Demographics Similar to Moroccans by 2 or more Vehicles in Household
In terms of 2 or more vehicles in household, the demographic groups most similar to Moroccans are Albanian (49.0%, a difference of 0.35%), Hopi (49.0%, a difference of 0.42%), Immigrants from Israel (49.2%, a difference of 0.85%), Immigrants from Western Africa (49.4%, a difference of 1.1%), and Ghanaian (48.0%, a difference of 1.8%).
| Demographics | Rating | Rank | 2 or more Vehicles in Household |
| Immigrants | South America | 0.0 /100 | #302 | Tragic 50.2% |
| Tohono O'odham | 0.0 /100 | #303 | Tragic 50.0% |
| Immigrants | Belize | 0.0 /100 | #304 | Tragic 49.9% |
| Immigrants | Western Africa | 0.0 /100 | #305 | Tragic 49.4% |
| Immigrants | Israel | 0.0 /100 | #306 | Tragic 49.2% |
| Hopi | 0.0 /100 | #307 | Tragic 49.0% |
| Albanians | 0.0 /100 | #308 | Tragic 49.0% |
| Moroccans | 0.0 /100 | #309 | Tragic 48.8% |
| Ghanaians | 0.0 /100 | #310 | Tragic 48.0% |
| Immigrants | Belarus | 0.0 /100 | #311 | Tragic 47.9% |
| Haitians | 0.0 /100 | #312 | Tragic 47.6% |
| U.S. Virgin Islanders | 0.0 /100 | #313 | Tragic 47.5% |
| Immigrants | Ghana | 0.0 /100 | #314 | Tragic 47.4% |
| Puerto Ricans | 0.0 /100 | #315 | Tragic 47.1% |
| Cape Verdeans | 0.0 /100 | #316 | Tragic 46.8% |