Immigrants from Laos vs Ute 2 or more Vehicles in Household
COMPARE
Immigrants from Laos
Ute
2 or more Vehicles in Household
2 or more Vehicles in Household Comparison
Immigrants from Laos
Ute
59.2%
2 OR MORE VEHICLES IN HOUSEHOLD
99.9/ 100
METRIC RATING
52nd/ 347
METRIC RANK
56.6%
2 OR MORE VEHICLES IN HOUSEHOLD
90.4/ 100
METRIC RATING
129th/ 347
METRIC RANK
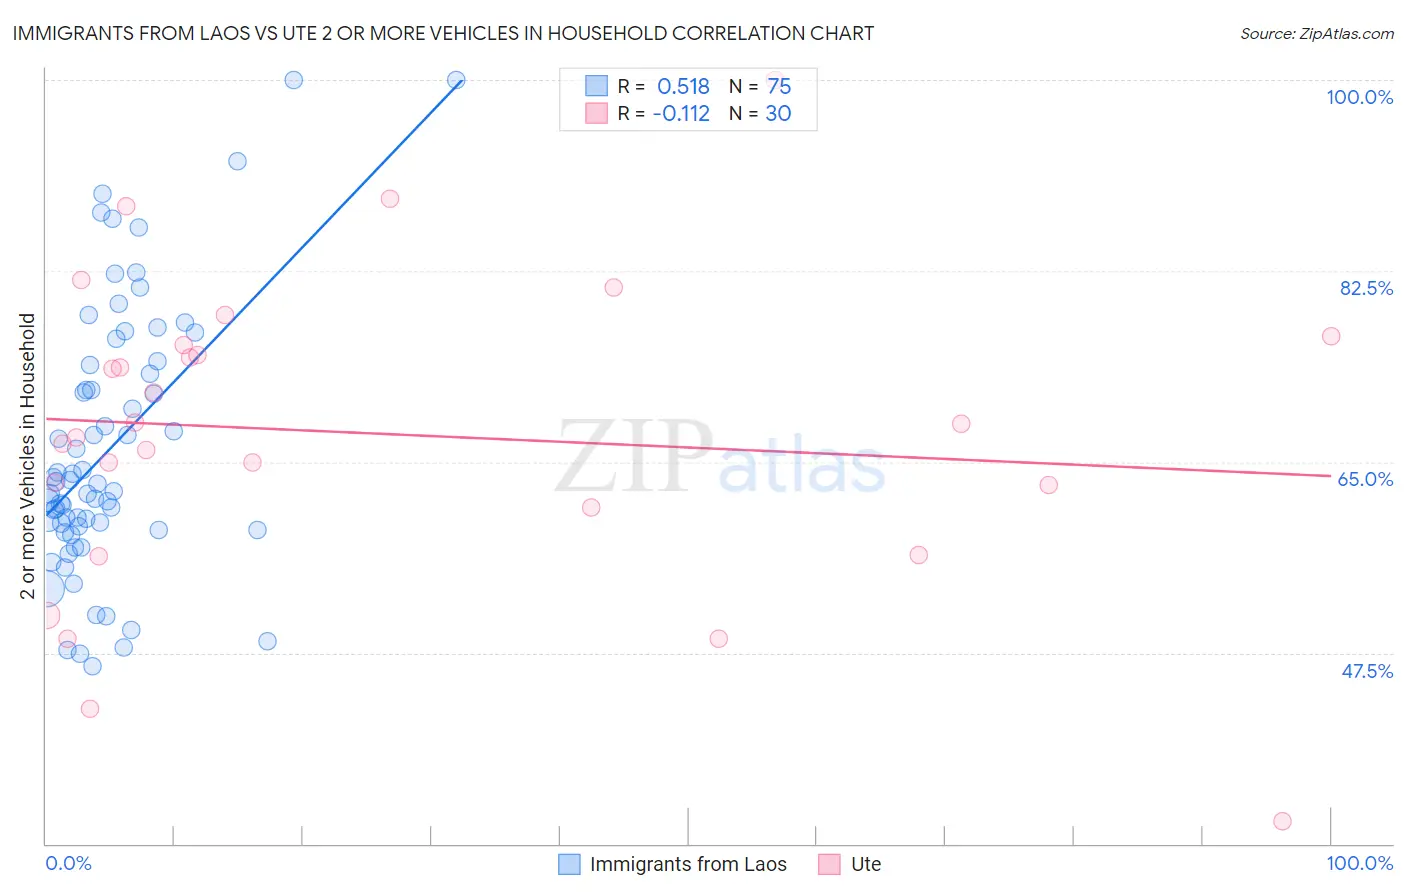
Immigrants from Laos vs Ute 2 or more Vehicles in Household Correlation Chart
The statistical analysis conducted on geographies consisting of 201,468,892 people shows a substantial positive correlation between the proportion of Immigrants from Laos and percentage of households with 2 or more vehicles available in the United States with a correlation coefficient (R) of 0.518 and weighted average of 59.2%. Similarly, the statistical analysis conducted on geographies consisting of 55,668,301 people shows a poor negative correlation between the proportion of Ute and percentage of households with 2 or more vehicles available in the United States with a correlation coefficient (R) of -0.112 and weighted average of 56.6%, a difference of 4.6%.
2 or more Vehicles in Household Correlation Summary
| Measurement | Immigrants from Laos | Ute |
| Minimum | 46.3% | 32.0% |
| Maximum | 100.0% | 100.0% |
| Range | 53.7% | 68.0% |
| Mean | 66.2% | 67.6% |
| Median | 63.0% | 67.9% |
| Interquartile 25% (IQ1) | 58.8% | 60.8% |
| Interquartile 75% (IQ3) | 73.9% | 75.7% |
| Interquartile Range (IQR) | 15.1% | 14.9% |
| Standard Deviation (Sample) | 12.2% | 14.4% |
| Standard Deviation (Population) | 12.1% | 14.2% |
Similar Demographics by 2 or more Vehicles in Household
Demographics Similar to Immigrants from Laos by 2 or more Vehicles in Household
In terms of 2 or more vehicles in household, the demographic groups most similar to Immigrants from Laos are Spaniard (59.2%, a difference of 0.0%), Celtic (59.2%, a difference of 0.010%), Choctaw (59.3%, a difference of 0.14%), Belgian (59.3%, a difference of 0.15%), and Bhutanese (59.1%, a difference of 0.16%).
| Demographics | Rating | Rank | 2 or more Vehicles in Household |
| Immigrants | Taiwan | 100.0 /100 | #45 | Exceptional 59.7% |
| Immigrants | South Eastern Asia | 100.0 /100 | #46 | Exceptional 59.6% |
| Yaqui | 99.9 /100 | #47 | Exceptional 59.3% |
| Immigrants | India | 99.9 /100 | #48 | Exceptional 59.3% |
| Belgians | 99.9 /100 | #49 | Exceptional 59.3% |
| Choctaw | 99.9 /100 | #50 | Exceptional 59.3% |
| Spaniards | 99.9 /100 | #51 | Exceptional 59.2% |
| Immigrants | Laos | 99.9 /100 | #52 | Exceptional 59.2% |
| Celtics | 99.9 /100 | #53 | Exceptional 59.2% |
| Bhutanese | 99.9 /100 | #54 | Exceptional 59.1% |
| Luxembourgers | 99.9 /100 | #55 | Exceptional 59.1% |
| Chickasaw | 99.9 /100 | #56 | Exceptional 59.0% |
| Afghans | 99.9 /100 | #57 | Exceptional 59.0% |
| Immigrants | Scotland | 99.8 /100 | #58 | Exceptional 58.9% |
| Spanish Americans | 99.8 /100 | #59 | Exceptional 58.9% |
Demographics Similar to Ute by 2 or more Vehicles in Household
In terms of 2 or more vehicles in household, the demographic groups most similar to Ute are Immigrants from South Central Asia (56.6%, a difference of 0.020%), Immigrants from Thailand (56.6%, a difference of 0.030%), Yugoslavian (56.6%, a difference of 0.040%), Estonian (56.6%, a difference of 0.070%), and Bulgarian (56.5%, a difference of 0.070%).
| Demographics | Rating | Rank | 2 or more Vehicles in Household |
| Immigrants | South Africa | 92.5 /100 | #122 | Exceptional 56.7% |
| Australians | 91.8 /100 | #123 | Exceptional 56.7% |
| New Zealanders | 91.8 /100 | #124 | Exceptional 56.7% |
| Tsimshian | 91.6 /100 | #125 | Exceptional 56.7% |
| Estonians | 90.9 /100 | #126 | Exceptional 56.6% |
| Immigrants | Thailand | 90.7 /100 | #127 | Exceptional 56.6% |
| Immigrants | South Central Asia | 90.5 /100 | #128 | Exceptional 56.6% |
| Ute | 90.4 /100 | #129 | Exceptional 56.6% |
| Yugoslavians | 90.0 /100 | #130 | Exceptional 56.6% |
| Bulgarians | 89.7 /100 | #131 | Excellent 56.5% |
| Hungarians | 89.1 /100 | #132 | Excellent 56.5% |
| Comanche | 88.4 /100 | #133 | Excellent 56.5% |
| Immigrants | Azores | 86.6 /100 | #134 | Excellent 56.4% |
| Blackfeet | 86.5 /100 | #135 | Excellent 56.4% |
| Immigrants | Asia | 86.0 /100 | #136 | Excellent 56.3% |