Nepalese vs Ute 2 or more Vehicles in Household
COMPARE
Nepalese
Ute
2 or more Vehicles in Household
2 or more Vehicles in Household Comparison
Nepalese
Ute
61.4%
2 OR MORE VEHICLES IN HOUSEHOLD
100.0/ 100
METRIC RATING
15th/ 347
METRIC RANK
56.6%
2 OR MORE VEHICLES IN HOUSEHOLD
90.4/ 100
METRIC RATING
129th/ 347
METRIC RANK
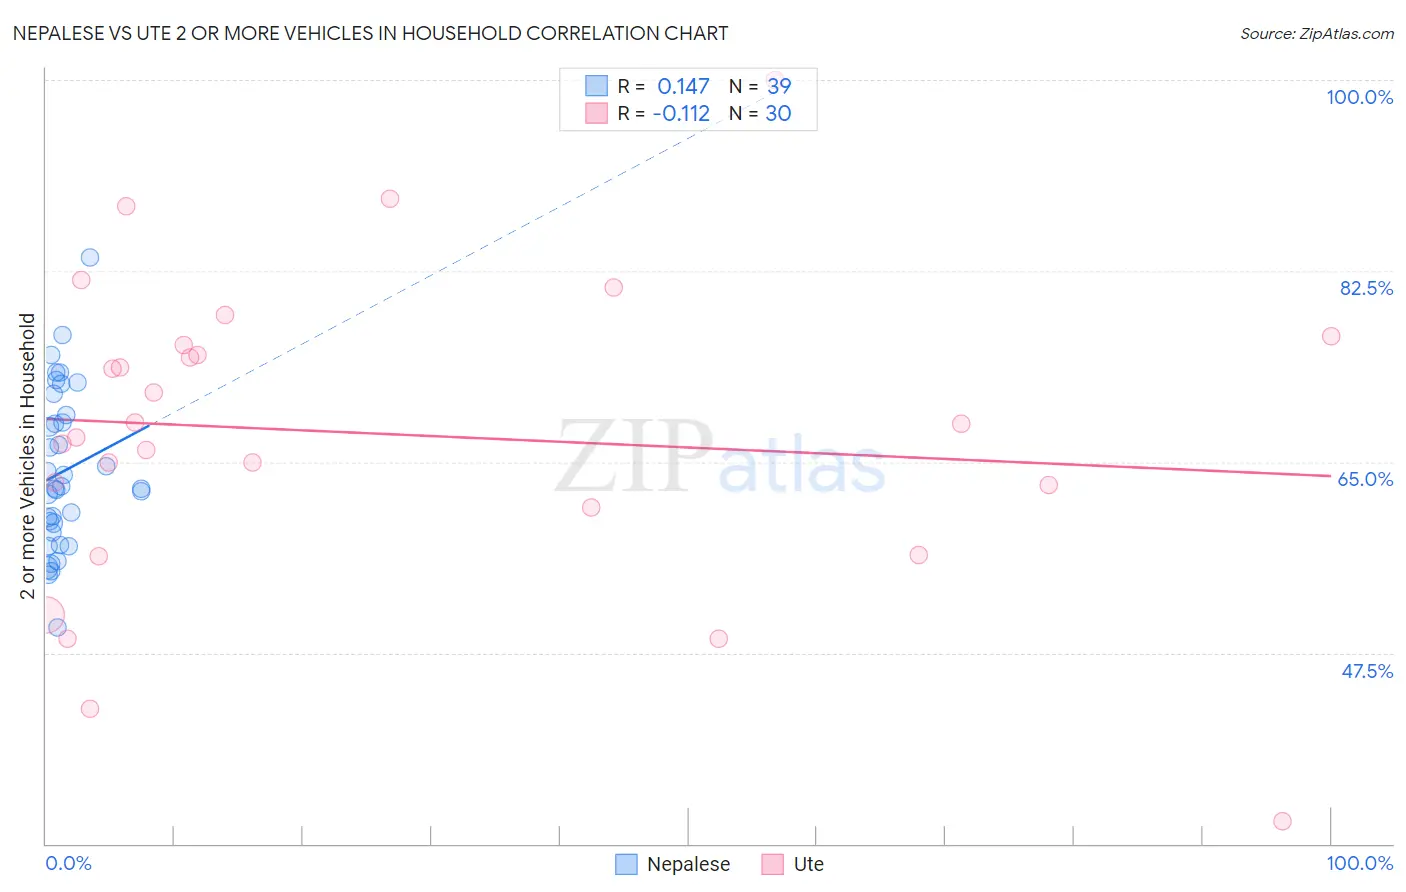
Nepalese vs Ute 2 or more Vehicles in Household Correlation Chart
The statistical analysis conducted on geographies consisting of 24,483,296 people shows a poor positive correlation between the proportion of Nepalese and percentage of households with 2 or more vehicles available in the United States with a correlation coefficient (R) of 0.147 and weighted average of 61.4%. Similarly, the statistical analysis conducted on geographies consisting of 55,668,301 people shows a poor negative correlation between the proportion of Ute and percentage of households with 2 or more vehicles available in the United States with a correlation coefficient (R) of -0.112 and weighted average of 56.6%, a difference of 8.6%.
2 or more Vehicles in Household Correlation Summary
| Measurement | Nepalese | Ute |
| Minimum | 49.8% | 32.0% |
| Maximum | 83.8% | 100.0% |
| Range | 33.9% | 68.0% |
| Mean | 64.1% | 67.6% |
| Median | 62.5% | 67.9% |
| Interquartile 25% (IQ1) | 58.6% | 60.8% |
| Interquartile 75% (IQ3) | 69.3% | 75.7% |
| Interquartile Range (IQR) | 10.7% | 14.9% |
| Standard Deviation (Sample) | 7.3% | 14.4% |
| Standard Deviation (Population) | 7.2% | 14.2% |
Similar Demographics by 2 or more Vehicles in Household
Demographics Similar to Nepalese by 2 or more Vehicles in Household
In terms of 2 or more vehicles in household, the demographic groups most similar to Nepalese are Native Hawaiian (61.4%, a difference of 0.020%), Czech (61.5%, a difference of 0.090%), Basque (61.4%, a difference of 0.090%), European (61.4%, a difference of 0.10%), and Samoan (61.5%, a difference of 0.14%).
| Demographics | Rating | Rank | 2 or more Vehicles in Household |
| English | 100.0 /100 | #8 | Exceptional 61.9% |
| Swedes | 100.0 /100 | #9 | Exceptional 61.8% |
| Mexicans | 100.0 /100 | #10 | Exceptional 61.7% |
| Dutch | 100.0 /100 | #11 | Exceptional 61.6% |
| Germans | 100.0 /100 | #12 | Exceptional 61.6% |
| Samoans | 100.0 /100 | #13 | Exceptional 61.5% |
| Czechs | 100.0 /100 | #14 | Exceptional 61.5% |
| Nepalese | 100.0 /100 | #15 | Exceptional 61.4% |
| Native Hawaiians | 100.0 /100 | #16 | Exceptional 61.4% |
| Basques | 100.0 /100 | #17 | Exceptional 61.4% |
| Europeans | 100.0 /100 | #18 | Exceptional 61.4% |
| Scottish | 100.0 /100 | #19 | Exceptional 61.2% |
| Sri Lankans | 100.0 /100 | #20 | Exceptional 61.0% |
| Koreans | 100.0 /100 | #21 | Exceptional 61.0% |
| Swiss | 100.0 /100 | #22 | Exceptional 61.0% |
Demographics Similar to Ute by 2 or more Vehicles in Household
In terms of 2 or more vehicles in household, the demographic groups most similar to Ute are Immigrants from South Central Asia (56.6%, a difference of 0.020%), Immigrants from Thailand (56.6%, a difference of 0.030%), Yugoslavian (56.6%, a difference of 0.040%), Estonian (56.6%, a difference of 0.070%), and Bulgarian (56.5%, a difference of 0.070%).
| Demographics | Rating | Rank | 2 or more Vehicles in Household |
| Immigrants | South Africa | 92.5 /100 | #122 | Exceptional 56.7% |
| Australians | 91.8 /100 | #123 | Exceptional 56.7% |
| New Zealanders | 91.8 /100 | #124 | Exceptional 56.7% |
| Tsimshian | 91.6 /100 | #125 | Exceptional 56.7% |
| Estonians | 90.9 /100 | #126 | Exceptional 56.6% |
| Immigrants | Thailand | 90.7 /100 | #127 | Exceptional 56.6% |
| Immigrants | South Central Asia | 90.5 /100 | #128 | Exceptional 56.6% |
| Ute | 90.4 /100 | #129 | Exceptional 56.6% |
| Yugoslavians | 90.0 /100 | #130 | Exceptional 56.6% |
| Bulgarians | 89.7 /100 | #131 | Excellent 56.5% |
| Hungarians | 89.1 /100 | #132 | Excellent 56.5% |
| Comanche | 88.4 /100 | #133 | Excellent 56.5% |
| Immigrants | Azores | 86.6 /100 | #134 | Excellent 56.4% |
| Blackfeet | 86.5 /100 | #135 | Excellent 56.4% |
| Immigrants | Asia | 86.0 /100 | #136 | Excellent 56.3% |