Immigrants from Laos vs Ute Unemployment Among Women with Children Under 18 years
COMPARE
Immigrants from Laos
Ute
Unemployment Among Women with Children Under 18 years
Unemployment Among Women with Children Under 18 years Comparison
Immigrants from Laos
Ute
5.5%
UNEMPLOYMENT AMONG WOMEN WITH CHILDREN UNDER 18 YEARS
38.8/ 100
METRIC RATING
183rd/ 347
METRIC RANK
5.9%
UNEMPLOYMENT AMONG WOMEN WITH CHILDREN UNDER 18 YEARS
0.7/ 100
METRIC RATING
251st/ 347
METRIC RANK
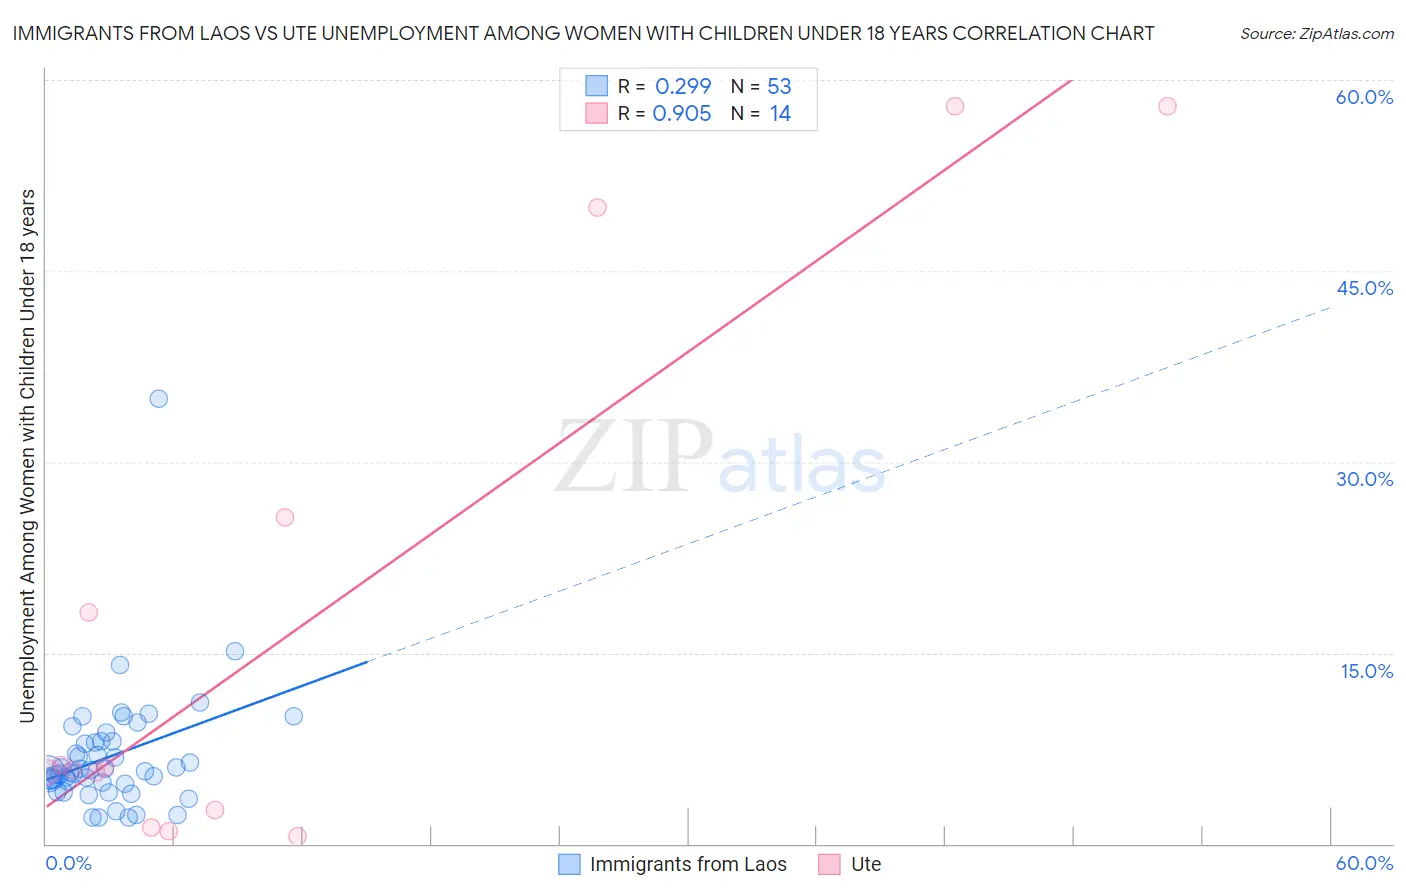
Immigrants from Laos vs Ute Unemployment Among Women with Children Under 18 years Correlation Chart
The statistical analysis conducted on geographies consisting of 197,766,364 people shows a weak positive correlation between the proportion of Immigrants from Laos and unemployment rate among women with children under the age of 18 in the United States with a correlation coefficient (R) of 0.299 and weighted average of 5.5%. Similarly, the statistical analysis conducted on geographies consisting of 55,040,080 people shows a near-perfect positive correlation between the proportion of Ute and unemployment rate among women with children under the age of 18 in the United States with a correlation coefficient (R) of 0.905 and weighted average of 5.9%, a difference of 7.8%.
Unemployment Among Women with Children Under 18 years Correlation Summary
| Measurement | Immigrants from Laos | Ute |
| Minimum | 2.0% | 0.60% |
| Maximum | 35.0% | 57.9% |
| Range | 33.0% | 57.3% |
| Mean | 6.9% | 17.5% |
| Median | 5.7% | 5.9% |
| Interquartile 25% (IQ1) | 4.8% | 2.7% |
| Interquartile 75% (IQ3) | 8.1% | 25.6% |
| Interquartile Range (IQR) | 3.3% | 22.9% |
| Standard Deviation (Sample) | 4.9% | 21.7% |
| Standard Deviation (Population) | 4.8% | 20.9% |
Similar Demographics by Unemployment Among Women with Children Under 18 years
Demographics Similar to Immigrants from Laos by Unemployment Among Women with Children Under 18 years
In terms of unemployment among women with children under 18 years, the demographic groups most similar to Immigrants from Laos are Immigrants from Cambodia (5.5%, a difference of 0.030%), Immigrants from Zaire (5.5%, a difference of 0.050%), Immigrants from Sudan (5.5%, a difference of 0.13%), Indonesian (5.5%, a difference of 0.18%), and Immigrants from Hungary (5.5%, a difference of 0.19%).
| Demographics | Rating | Rank | Unemployment Among Women with Children Under 18 years |
| Immigrants | Germany | 48.5 /100 | #176 | Average 5.5% |
| Hawaiians | 46.1 /100 | #177 | Average 5.5% |
| Costa Ricans | 45.2 /100 | #178 | Average 5.5% |
| Syrians | 42.8 /100 | #179 | Average 5.5% |
| Immigrants | Southern Europe | 42.7 /100 | #180 | Average 5.5% |
| Immigrants | Hungary | 41.3 /100 | #181 | Average 5.5% |
| Immigrants | Sudan | 40.6 /100 | #182 | Average 5.5% |
| Immigrants | Laos | 38.8 /100 | #183 | Fair 5.5% |
| Immigrants | Cambodia | 38.4 /100 | #184 | Fair 5.5% |
| Immigrants | Zaire | 38.1 /100 | #185 | Fair 5.5% |
| Indonesians | 36.3 /100 | #186 | Fair 5.5% |
| Malaysians | 35.7 /100 | #187 | Fair 5.5% |
| Iraqis | 35.3 /100 | #188 | Fair 5.5% |
| Immigrants | Eritrea | 33.8 /100 | #189 | Fair 5.5% |
| Immigrants | Poland | 31.2 /100 | #190 | Fair 5.5% |
Demographics Similar to Ute by Unemployment Among Women with Children Under 18 years
In terms of unemployment among women with children under 18 years, the demographic groups most similar to Ute are Immigrants from Cabo Verde (5.9%, a difference of 0.010%), Immigrants from Cameroon (5.9%, a difference of 0.080%), Delaware (5.9%, a difference of 0.23%), Cape Verdean (5.9%, a difference of 0.44%), and Uruguayan (5.9%, a difference of 0.52%).
| Demographics | Rating | Rank | Unemployment Among Women with Children Under 18 years |
| Choctaw | 1.1 /100 | #244 | Tragic 5.9% |
| Ugandans | 1.1 /100 | #245 | Tragic 5.9% |
| Uruguayans | 1.0 /100 | #246 | Tragic 5.9% |
| Cape Verdeans | 1.0 /100 | #247 | Tragic 5.9% |
| Delaware | 0.8 /100 | #248 | Tragic 5.9% |
| Immigrants | Cameroon | 0.8 /100 | #249 | Tragic 5.9% |
| Immigrants | Cabo Verde | 0.7 /100 | #250 | Tragic 5.9% |
| Ute | 0.7 /100 | #251 | Tragic 5.9% |
| Seminole | 0.5 /100 | #252 | Tragic 6.0% |
| Immigrants | Congo | 0.4 /100 | #253 | Tragic 6.0% |
| Immigrants | Azores | 0.3 /100 | #254 | Tragic 6.0% |
| Liberians | 0.2 /100 | #255 | Tragic 6.0% |
| Nepalese | 0.2 /100 | #256 | Tragic 6.0% |
| Bermudans | 0.1 /100 | #257 | Tragic 6.1% |
| Immigrants | Nigeria | 0.1 /100 | #258 | Tragic 6.1% |