Immigrants from Zaire vs Ute 2 or more Vehicles in Household
COMPARE
Immigrants from Zaire
Ute
2 or more Vehicles in Household
2 or more Vehicles in Household Comparison
Immigrants from Zaire
Ute
51.5%
2 OR MORE VEHICLES IN HOUSEHOLD
0.1/ 100
METRIC RATING
284th/ 347
METRIC RANK
56.6%
2 OR MORE VEHICLES IN HOUSEHOLD
90.4/ 100
METRIC RATING
129th/ 347
METRIC RANK
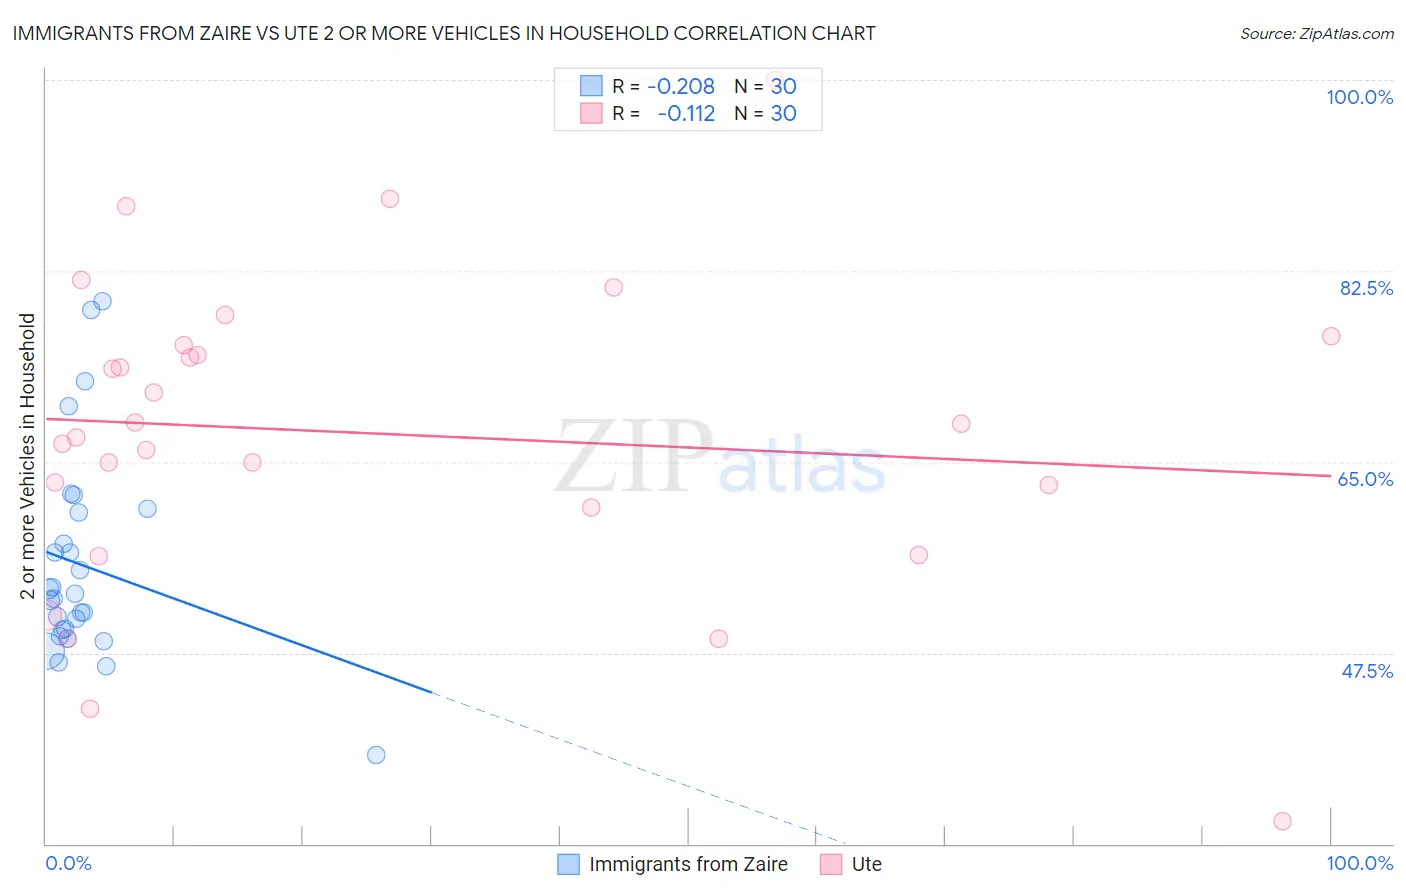
Immigrants from Zaire vs Ute 2 or more Vehicles in Household Correlation Chart
The statistical analysis conducted on geographies consisting of 107,246,082 people shows a weak negative correlation between the proportion of Immigrants from Zaire and percentage of households with 2 or more vehicles available in the United States with a correlation coefficient (R) of -0.208 and weighted average of 51.5%. Similarly, the statistical analysis conducted on geographies consisting of 55,668,301 people shows a poor negative correlation between the proportion of Ute and percentage of households with 2 or more vehicles available in the United States with a correlation coefficient (R) of -0.112 and weighted average of 56.6%, a difference of 9.9%.
2 or more Vehicles in Household Correlation Summary
| Measurement | Immigrants from Zaire | Ute |
| Minimum | 38.1% | 32.0% |
| Maximum | 79.7% | 100.0% |
| Range | 41.6% | 68.0% |
| Mean | 55.5% | 67.6% |
| Median | 52.7% | 67.9% |
| Interquartile 25% (IQ1) | 49.5% | 60.8% |
| Interquartile 75% (IQ3) | 60.4% | 75.7% |
| Interquartile Range (IQR) | 10.8% | 14.9% |
| Standard Deviation (Sample) | 9.5% | 14.4% |
| Standard Deviation (Population) | 9.4% | 14.2% |
Similar Demographics by 2 or more Vehicles in Household
Demographics Similar to Immigrants from Zaire by 2 or more Vehicles in Household
In terms of 2 or more vehicles in household, the demographic groups most similar to Immigrants from Zaire are Immigrants from China (51.5%, a difference of 0.040%), Bahamian (51.5%, a difference of 0.12%), Immigrants from Uruguay (51.4%, a difference of 0.16%), Immigrants from Kazakhstan (51.6%, a difference of 0.18%), and Immigrants from Liberia (51.3%, a difference of 0.30%).
| Demographics | Rating | Rank | 2 or more Vehicles in Household |
| Immigrants | Africa | 0.2 /100 | #277 | Tragic 51.8% |
| Yuman | 0.1 /100 | #278 | Tragic 51.7% |
| Liberians | 0.1 /100 | #279 | Tragic 51.7% |
| Immigrants | Eastern Europe | 0.1 /100 | #280 | Tragic 51.7% |
| Immigrants | Kazakhstan | 0.1 /100 | #281 | Tragic 51.6% |
| Bahamians | 0.1 /100 | #282 | Tragic 51.5% |
| Immigrants | China | 0.1 /100 | #283 | Tragic 51.5% |
| Immigrants | Zaire | 0.1 /100 | #284 | Tragic 51.5% |
| Immigrants | Uruguay | 0.1 /100 | #285 | Tragic 51.4% |
| Immigrants | Liberia | 0.1 /100 | #286 | Tragic 51.3% |
| Immigrants | Serbia | 0.1 /100 | #287 | Tragic 51.3% |
| Okinawans | 0.1 /100 | #288 | Tragic 51.2% |
| Somalis | 0.0 /100 | #289 | Tragic 51.1% |
| Immigrants | Panama | 0.0 /100 | #290 | Tragic 51.1% |
| Belizeans | 0.0 /100 | #291 | Tragic 51.0% |
Demographics Similar to Ute by 2 or more Vehicles in Household
In terms of 2 or more vehicles in household, the demographic groups most similar to Ute are Immigrants from South Central Asia (56.6%, a difference of 0.020%), Immigrants from Thailand (56.6%, a difference of 0.030%), Yugoslavian (56.6%, a difference of 0.040%), Estonian (56.6%, a difference of 0.070%), and Bulgarian (56.5%, a difference of 0.070%).
| Demographics | Rating | Rank | 2 or more Vehicles in Household |
| Immigrants | South Africa | 92.5 /100 | #122 | Exceptional 56.7% |
| Australians | 91.8 /100 | #123 | Exceptional 56.7% |
| New Zealanders | 91.8 /100 | #124 | Exceptional 56.7% |
| Tsimshian | 91.6 /100 | #125 | Exceptional 56.7% |
| Estonians | 90.9 /100 | #126 | Exceptional 56.6% |
| Immigrants | Thailand | 90.7 /100 | #127 | Exceptional 56.6% |
| Immigrants | South Central Asia | 90.5 /100 | #128 | Exceptional 56.6% |
| Ute | 90.4 /100 | #129 | Exceptional 56.6% |
| Yugoslavians | 90.0 /100 | #130 | Exceptional 56.6% |
| Bulgarians | 89.7 /100 | #131 | Excellent 56.5% |
| Hungarians | 89.1 /100 | #132 | Excellent 56.5% |
| Comanche | 88.4 /100 | #133 | Excellent 56.5% |
| Immigrants | Azores | 86.6 /100 | #134 | Excellent 56.4% |
| Blackfeet | 86.5 /100 | #135 | Excellent 56.4% |
| Immigrants | Asia | 86.0 /100 | #136 | Excellent 56.3% |