Immigrants from Laos vs Ute College, 1 year or more
COMPARE
Immigrants from Laos
Ute
College, 1 year or more
College, 1 year or more Comparison
Immigrants from Laos
Ute
54.7%
COLLEGE, 1 YEAR OR MORE
0.2/ 100
METRIC RATING
265th/ 347
METRIC RANK
53.8%
COLLEGE, 1 YEAR OR MORE
0.1/ 100
METRIC RATING
284th/ 347
METRIC RANK
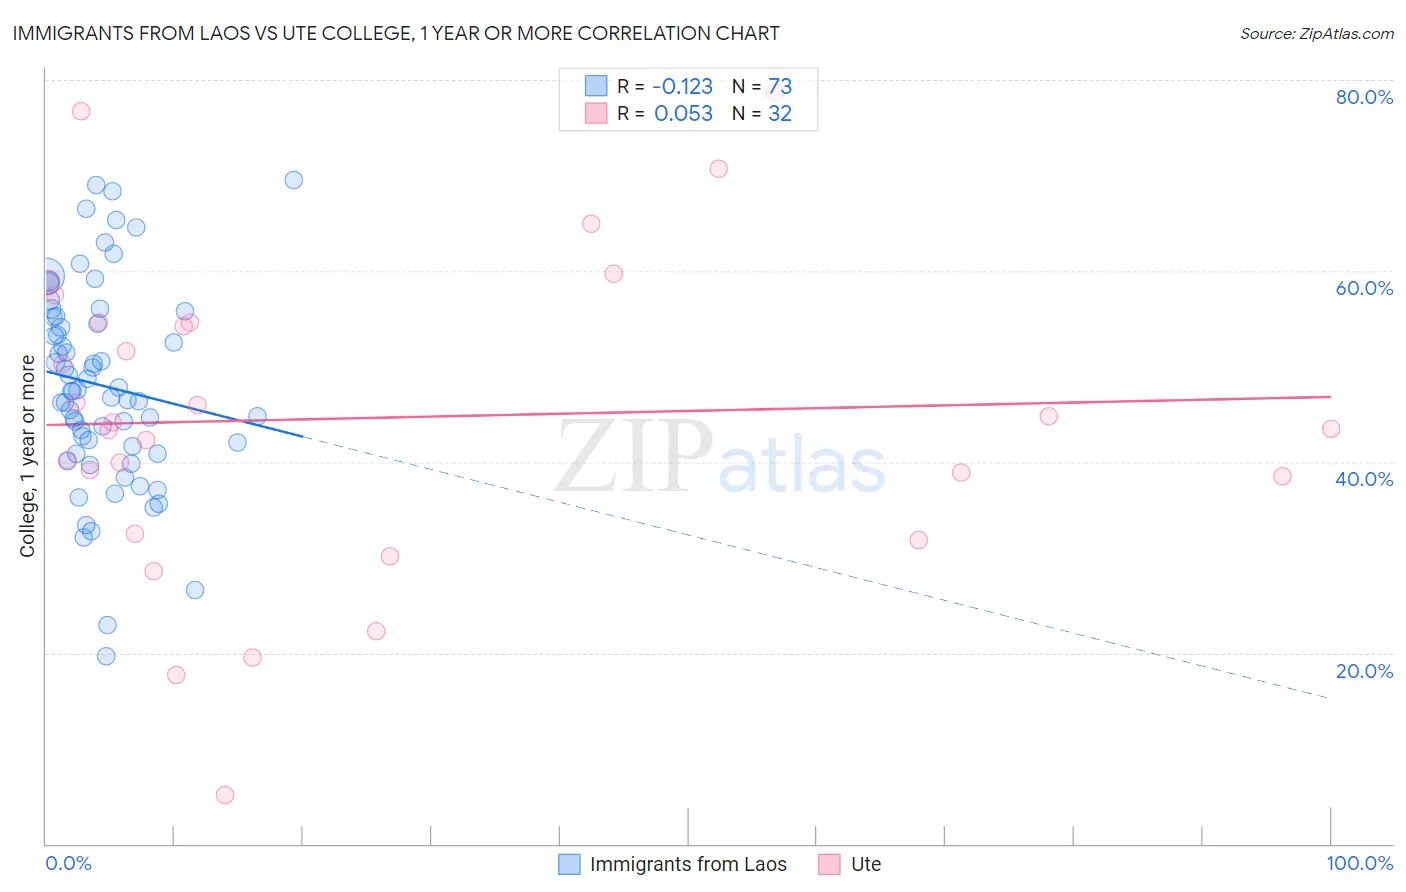
Immigrants from Laos vs Ute College, 1 year or more Correlation Chart
The statistical analysis conducted on geographies consisting of 201,475,535 people shows a poor negative correlation between the proportion of Immigrants from Laos and percentage of population with at least college, 1 year or more education in the United States with a correlation coefficient (R) of -0.123 and weighted average of 54.7%. Similarly, the statistical analysis conducted on geographies consisting of 55,668,599 people shows a slight positive correlation between the proportion of Ute and percentage of population with at least college, 1 year or more education in the United States with a correlation coefficient (R) of 0.053 and weighted average of 53.8%, a difference of 1.6%.
College, 1 year or more Correlation Summary
| Measurement | Immigrants from Laos | Ute |
| Minimum | 19.6% | 5.1% |
| Maximum | 69.6% | 78.7% |
| Range | 49.9% | 73.6% |
| Mean | 48.0% | 44.6% |
| Median | 47.5% | 43.8% |
| Interquartile 25% (IQ1) | 41.3% | 35.4% |
| Interquartile 75% (IQ3) | 55.2% | 54.6% |
| Interquartile Range (IQR) | 13.9% | 19.2% |
| Standard Deviation (Sample) | 10.5% | 16.7% |
| Standard Deviation (Population) | 10.4% | 16.4% |
Demographics Similar to Immigrants from Laos and Ute by College, 1 year or more
In terms of college, 1 year or more, the demographic groups most similar to Immigrants from Laos are Potawatomi (54.6%, a difference of 0.050%), Blackfeet (54.6%, a difference of 0.12%), Immigrants from Micronesia (54.8%, a difference of 0.19%), British West Indian (54.5%, a difference of 0.28%), and Bangladeshi (54.5%, a difference of 0.32%). Similarly, the demographic groups most similar to Ute are Nicaraguan (53.9%, a difference of 0.17%), Guyanese (54.1%, a difference of 0.53%), Colville (54.1%, a difference of 0.57%), Cheyenne (54.1%, a difference of 0.59%), and Arapaho (54.1%, a difference of 0.64%).
| Demographics | Rating | Rank | College, 1 year or more |
| Immigrants | Micronesia | 0.3 /100 | #264 | Tragic 54.8% |
| Immigrants | Laos | 0.2 /100 | #265 | Tragic 54.7% |
| Potawatomi | 0.2 /100 | #266 | Tragic 54.6% |
| Blackfeet | 0.2 /100 | #267 | Tragic 54.6% |
| British West Indians | 0.2 /100 | #268 | Tragic 54.5% |
| Bangladeshis | 0.2 /100 | #269 | Tragic 54.5% |
| Crow | 0.2 /100 | #270 | Tragic 54.5% |
| Bahamians | 0.2 /100 | #271 | Tragic 54.5% |
| Comanche | 0.2 /100 | #272 | Tragic 54.4% |
| Immigrants | Grenada | 0.2 /100 | #273 | Tragic 54.4% |
| Belizeans | 0.2 /100 | #274 | Tragic 54.4% |
| Americans | 0.2 /100 | #275 | Tragic 54.4% |
| Shoshone | 0.2 /100 | #276 | Tragic 54.3% |
| Ecuadorians | 0.2 /100 | #277 | Tragic 54.3% |
| Immigrants | Jamaica | 0.1 /100 | #278 | Tragic 54.2% |
| Arapaho | 0.1 /100 | #279 | Tragic 54.1% |
| Cheyenne | 0.1 /100 | #280 | Tragic 54.1% |
| Colville | 0.1 /100 | #281 | Tragic 54.1% |
| Guyanese | 0.1 /100 | #282 | Tragic 54.1% |
| Nicaraguans | 0.1 /100 | #283 | Tragic 53.9% |
| Ute | 0.1 /100 | #284 | Tragic 53.8% |