Immigrants from Laos vs Ute Unemployment
COMPARE
Immigrants from Laos
Ute
Unemployment
Unemployment Comparison
Immigrants from Laos
Ute
5.3%
UNEMPLOYMENT
30.9/ 100
METRIC RATING
194th/ 347
METRIC RANK
6.3%
UNEMPLOYMENT
0.0/ 100
METRIC RATING
296th/ 347
METRIC RANK
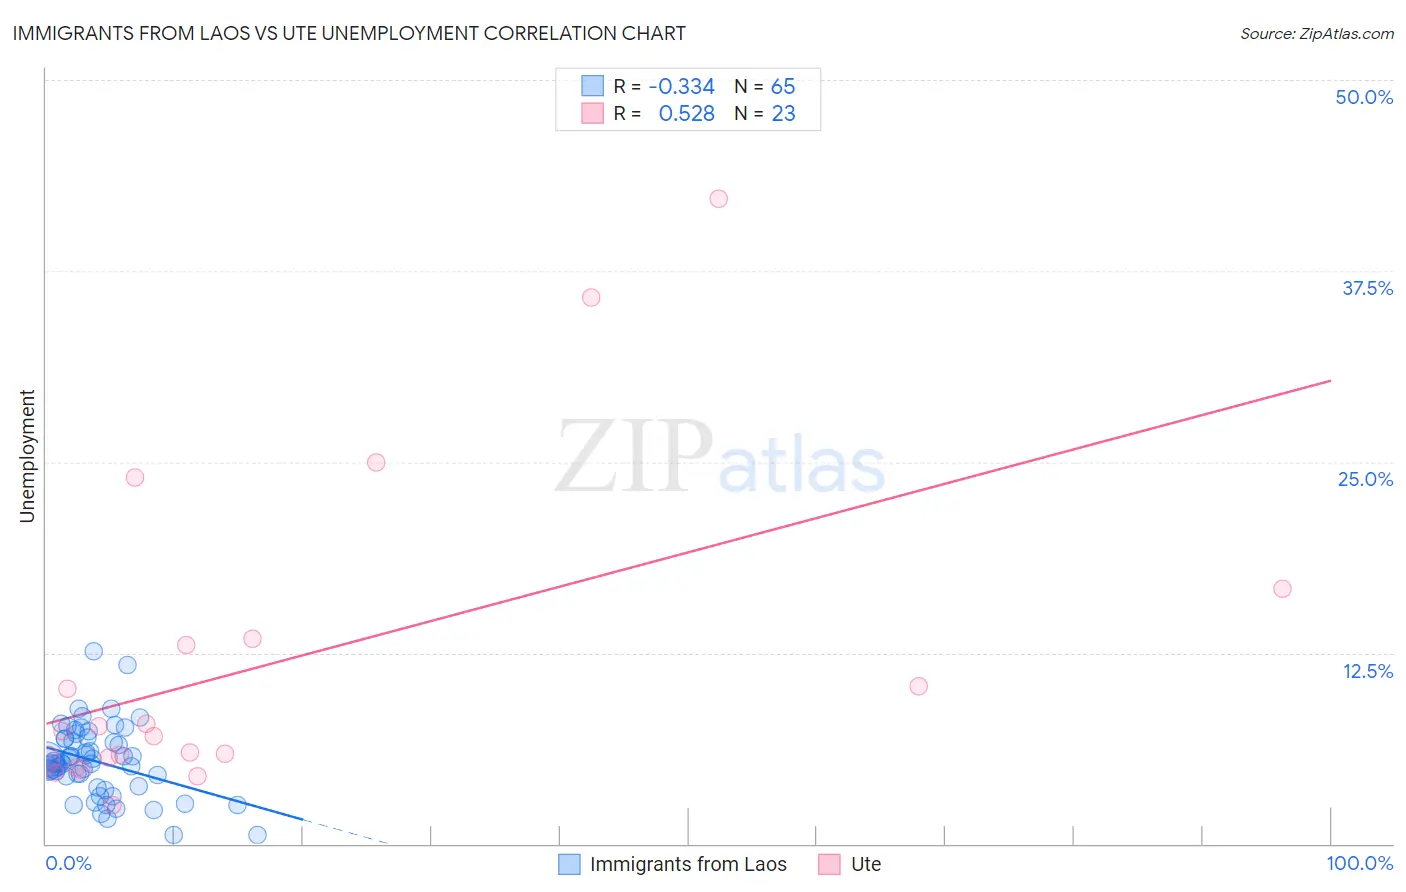
Immigrants from Laos vs Ute Unemployment Correlation Chart
The statistical analysis conducted on geographies consisting of 201,374,148 people shows a mild negative correlation between the proportion of Immigrants from Laos and unemployment in the United States with a correlation coefficient (R) of -0.334 and weighted average of 5.3%. Similarly, the statistical analysis conducted on geographies consisting of 55,641,971 people shows a substantial positive correlation between the proportion of Ute and unemployment in the United States with a correlation coefficient (R) of 0.528 and weighted average of 6.3%, a difference of 18.0%.
Unemployment Correlation Summary
| Measurement | Immigrants from Laos | Ute |
| Minimum | 0.60% | 2.5% |
| Maximum | 12.6% | 42.2% |
| Range | 12.0% | 39.7% |
| Mean | 5.4% | 11.8% |
| Median | 5.3% | 7.3% |
| Interquartile 25% (IQ1) | 4.1% | 5.5% |
| Interquartile 75% (IQ3) | 6.9% | 13.4% |
| Interquartile Range (IQR) | 2.7% | 7.9% |
| Standard Deviation (Sample) | 2.3% | 10.4% |
| Standard Deviation (Population) | 2.3% | 10.2% |
Similar Demographics by Unemployment
Demographics Similar to Immigrants from Laos by Unemployment
In terms of unemployment, the demographic groups most similar to Immigrants from Laos are Immigrants from Southern Europe (5.3%, a difference of 0.0%), Peruvian (5.3%, a difference of 0.080%), Immigrants from Uruguay (5.3%, a difference of 0.080%), Immigrants from Israel (5.3%, a difference of 0.17%), and Immigrants from Afghanistan (5.3%, a difference of 0.17%).
| Demographics | Rating | Rank | Unemployment |
| Costa Ricans | 37.4 /100 | #187 | Fair 5.3% |
| Alsatians | 37.0 /100 | #188 | Fair 5.3% |
| Immigrants | Belarus | 35.6 /100 | #189 | Fair 5.3% |
| Arabs | 35.3 /100 | #190 | Fair 5.3% |
| Somalis | 34.0 /100 | #191 | Fair 5.3% |
| South Americans | 33.9 /100 | #192 | Fair 5.3% |
| Immigrants | Somalia | 33.8 /100 | #193 | Fair 5.3% |
| Immigrants | Laos | 30.9 /100 | #194 | Fair 5.3% |
| Immigrants | Southern Europe | 30.9 /100 | #195 | Fair 5.3% |
| Peruvians | 29.9 /100 | #196 | Fair 5.3% |
| Immigrants | Uruguay | 29.8 /100 | #197 | Fair 5.3% |
| Immigrants | Israel | 28.6 /100 | #198 | Fair 5.3% |
| Immigrants | Afghanistan | 28.6 /100 | #199 | Fair 5.3% |
| Koreans | 27.4 /100 | #200 | Fair 5.3% |
| Immigrants | South Eastern Asia | 27.0 /100 | #201 | Fair 5.3% |
Demographics Similar to Ute by Unemployment
In terms of unemployment, the demographic groups most similar to Ute are Jamaican (6.3%, a difference of 0.34%), Immigrants from Haiti (6.3%, a difference of 0.43%), U.S. Virgin Islander (6.3%, a difference of 0.45%), Immigrants from West Indies (6.3%, a difference of 0.48%), and Immigrants from Ecuador (6.2%, a difference of 0.57%).
| Demographics | Rating | Rank | Unemployment |
| Chippewa | 0.0 /100 | #289 | Tragic 6.2% |
| Senegalese | 0.0 /100 | #290 | Tragic 6.2% |
| Haitians | 0.0 /100 | #291 | Tragic 6.2% |
| Central American Indians | 0.0 /100 | #292 | Tragic 6.2% |
| Immigrants | Ecuador | 0.0 /100 | #293 | Tragic 6.2% |
| Spanish American Indians | 0.0 /100 | #294 | Tragic 6.2% |
| U.S. Virgin Islanders | 0.0 /100 | #295 | Tragic 6.3% |
| Ute | 0.0 /100 | #296 | Tragic 6.3% |
| Jamaicans | 0.0 /100 | #297 | Tragic 6.3% |
| Immigrants | Haiti | 0.0 /100 | #298 | Tragic 6.3% |
| Immigrants | West Indies | 0.0 /100 | #299 | Tragic 6.3% |
| Immigrants | Trinidad and Tobago | 0.0 /100 | #300 | Tragic 6.3% |
| Trinidadians and Tobagonians | 0.0 /100 | #301 | Tragic 6.3% |
| West Indians | 0.0 /100 | #302 | Tragic 6.4% |
| Belizeans | 0.0 /100 | #303 | Tragic 6.4% |