Immigrants from Japan vs Marshallese 4 or more Vehicles in Household
COMPARE
Immigrants from Japan
Marshallese
4 or more Vehicles in Household
4 or more Vehicles in Household Comparison
Immigrants from Japan
Marshallese
6.3%
4 OR MORE VEHICLES IN HOUSEHOLD
43.1/ 100
METRIC RATING
179th/ 347
METRIC RANK
8.1%
4 OR MORE VEHICLES IN HOUSEHOLD
100.0/ 100
METRIC RATING
32nd/ 347
METRIC RANK
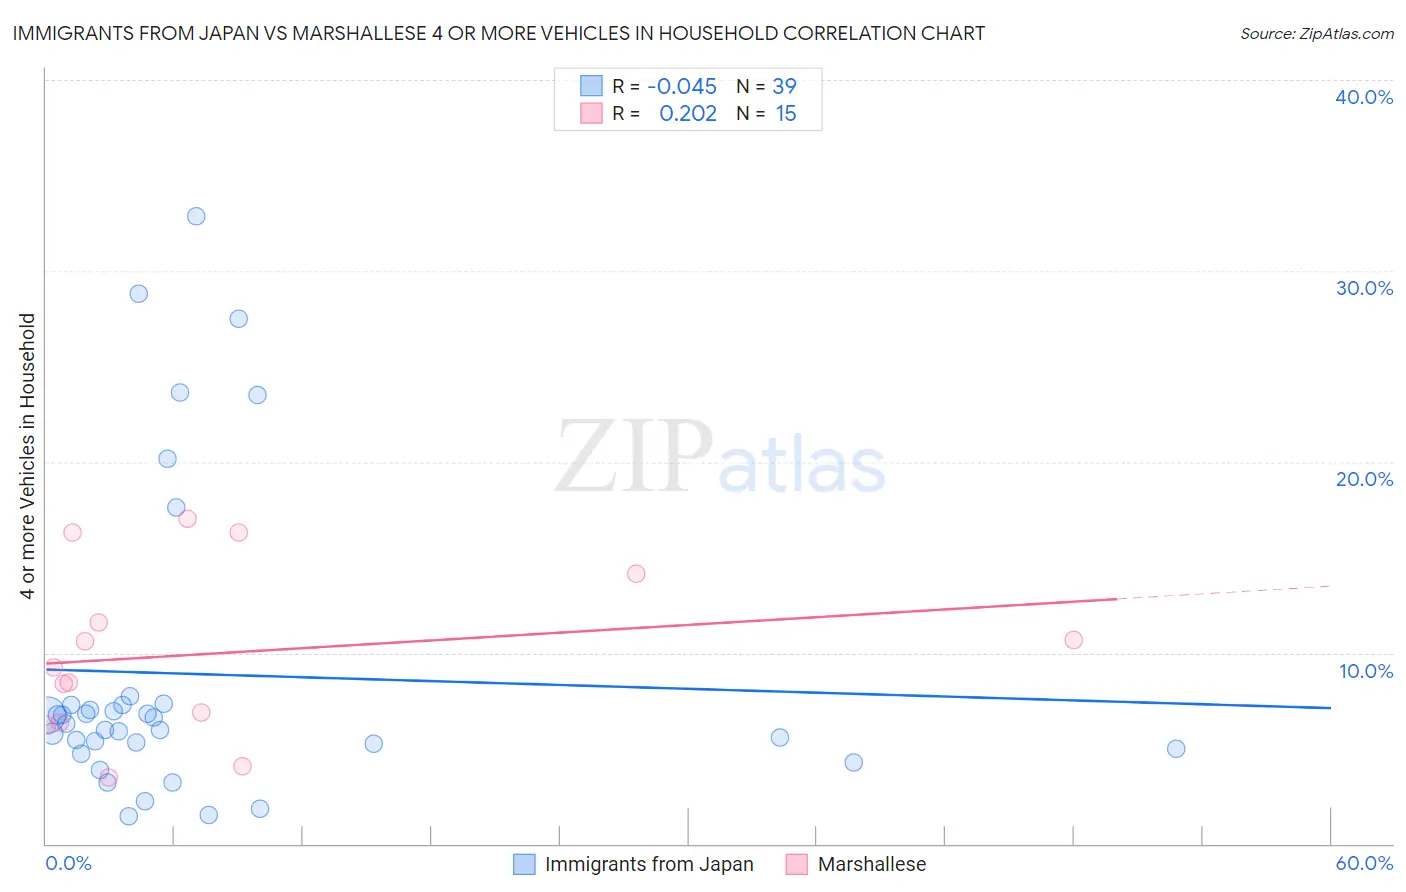
Immigrants from Japan vs Marshallese 4 or more Vehicles in Household Correlation Chart
The statistical analysis conducted on geographies consisting of 338,505,499 people shows no correlation between the proportion of Immigrants from Japan and percentage of households with 4 or more vehicles available in the United States with a correlation coefficient (R) of -0.045 and weighted average of 6.3%. Similarly, the statistical analysis conducted on geographies consisting of 14,760,409 people shows a weak positive correlation between the proportion of Marshallese and percentage of households with 4 or more vehicles available in the United States with a correlation coefficient (R) of 0.202 and weighted average of 8.1%, a difference of 29.7%.
4 or more Vehicles in Household Correlation Summary
| Measurement | Immigrants from Japan | Marshallese |
| Minimum | 1.5% | 3.5% |
| Maximum | 32.8% | 17.0% |
| Range | 31.4% | 13.5% |
| Mean | 8.9% | 10.0% |
| Median | 6.3% | 9.2% |
| Interquartile 25% (IQ1) | 5.0% | 6.3% |
| Interquartile 75% (IQ3) | 7.3% | 14.1% |
| Interquartile Range (IQR) | 2.3% | 7.8% |
| Standard Deviation (Sample) | 8.0% | 4.4% |
| Standard Deviation (Population) | 7.9% | 4.2% |
Similar Demographics by 4 or more Vehicles in Household
Demographics Similar to Immigrants from Japan by 4 or more Vehicles in Household
In terms of 4 or more vehicles in household, the demographic groups most similar to Immigrants from Japan are Syrian (6.3%, a difference of 0.11%), Belizean (6.3%, a difference of 0.15%), Yugoslavian (6.3%, a difference of 0.20%), South American Indian (6.3%, a difference of 0.25%), and Slovak (6.3%, a difference of 0.39%).
| Demographics | Rating | Rank | 4 or more Vehicles in Household |
| Immigrants | Lebanon | 51.7 /100 | #172 | Average 6.3% |
| Slovenes | 51.1 /100 | #173 | Average 6.3% |
| Lithuanians | 50.0 /100 | #174 | Average 6.3% |
| Immigrants | Western Europe | 48.8 /100 | #175 | Average 6.3% |
| Ukrainians | 47.6 /100 | #176 | Average 6.3% |
| Slovaks | 46.9 /100 | #177 | Average 6.3% |
| Belizeans | 44.5 /100 | #178 | Average 6.3% |
| Immigrants | Japan | 43.1 /100 | #179 | Average 6.3% |
| Syrians | 42.0 /100 | #180 | Average 6.3% |
| Yugoslavians | 41.1 /100 | #181 | Average 6.3% |
| South American Indians | 40.7 /100 | #182 | Average 6.3% |
| Immigrants | Burma/Myanmar | 37.5 /100 | #183 | Fair 6.2% |
| Iraqis | 37.3 /100 | #184 | Fair 6.2% |
| Thais | 36.9 /100 | #185 | Fair 6.2% |
| Immigrants | Northern Europe | 36.8 /100 | #186 | Fair 6.2% |
Demographics Similar to Marshallese by 4 or more Vehicles in Household
In terms of 4 or more vehicles in household, the demographic groups most similar to Marshallese are Yaqui (8.1%, a difference of 0.29%), Native/Alaskan (8.2%, a difference of 0.53%), Alaskan Athabascan (8.1%, a difference of 0.89%), Navajo (8.2%, a difference of 0.94%), and Immigrants from South Eastern Asia (8.2%, a difference of 0.97%).
| Demographics | Rating | Rank | 4 or more Vehicles in Household |
| Basques | 100.0 /100 | #25 | Exceptional 8.4% |
| Mexican American Indians | 100.0 /100 | #26 | Exceptional 8.4% |
| Sri Lankans | 100.0 /100 | #27 | Exceptional 8.4% |
| Cheyenne | 100.0 /100 | #28 | Exceptional 8.3% |
| Immigrants | South Eastern Asia | 100.0 /100 | #29 | Exceptional 8.2% |
| Navajo | 100.0 /100 | #30 | Exceptional 8.2% |
| Natives/Alaskans | 100.0 /100 | #31 | Exceptional 8.2% |
| Marshallese | 100.0 /100 | #32 | Exceptional 8.1% |
| Yaqui | 100.0 /100 | #33 | Exceptional 8.1% |
| Alaskan Athabascans | 100.0 /100 | #34 | Exceptional 8.1% |
| Guamanians/Chamorros | 100.0 /100 | #35 | Exceptional 8.1% |
| Norwegians | 100.0 /100 | #36 | Exceptional 8.0% |
| Scandinavians | 100.0 /100 | #37 | Exceptional 8.0% |
| Sioux | 100.0 /100 | #38 | Exceptional 8.0% |
| Spanish Americans | 100.0 /100 | #39 | Exceptional 8.0% |