Immigrants from Japan vs French American Indian 4 or more Vehicles in Household
COMPARE
Immigrants from Japan
French American Indian
4 or more Vehicles in Household
4 or more Vehicles in Household Comparison
Immigrants from Japan
French American Indians
6.3%
4 OR MORE VEHICLES IN HOUSEHOLD
43.1/ 100
METRIC RATING
179th/ 347
METRIC RANK
6.8%
4 OR MORE VEHICLES IN HOUSEHOLD
95.7/ 100
METRIC RATING
118th/ 347
METRIC RANK
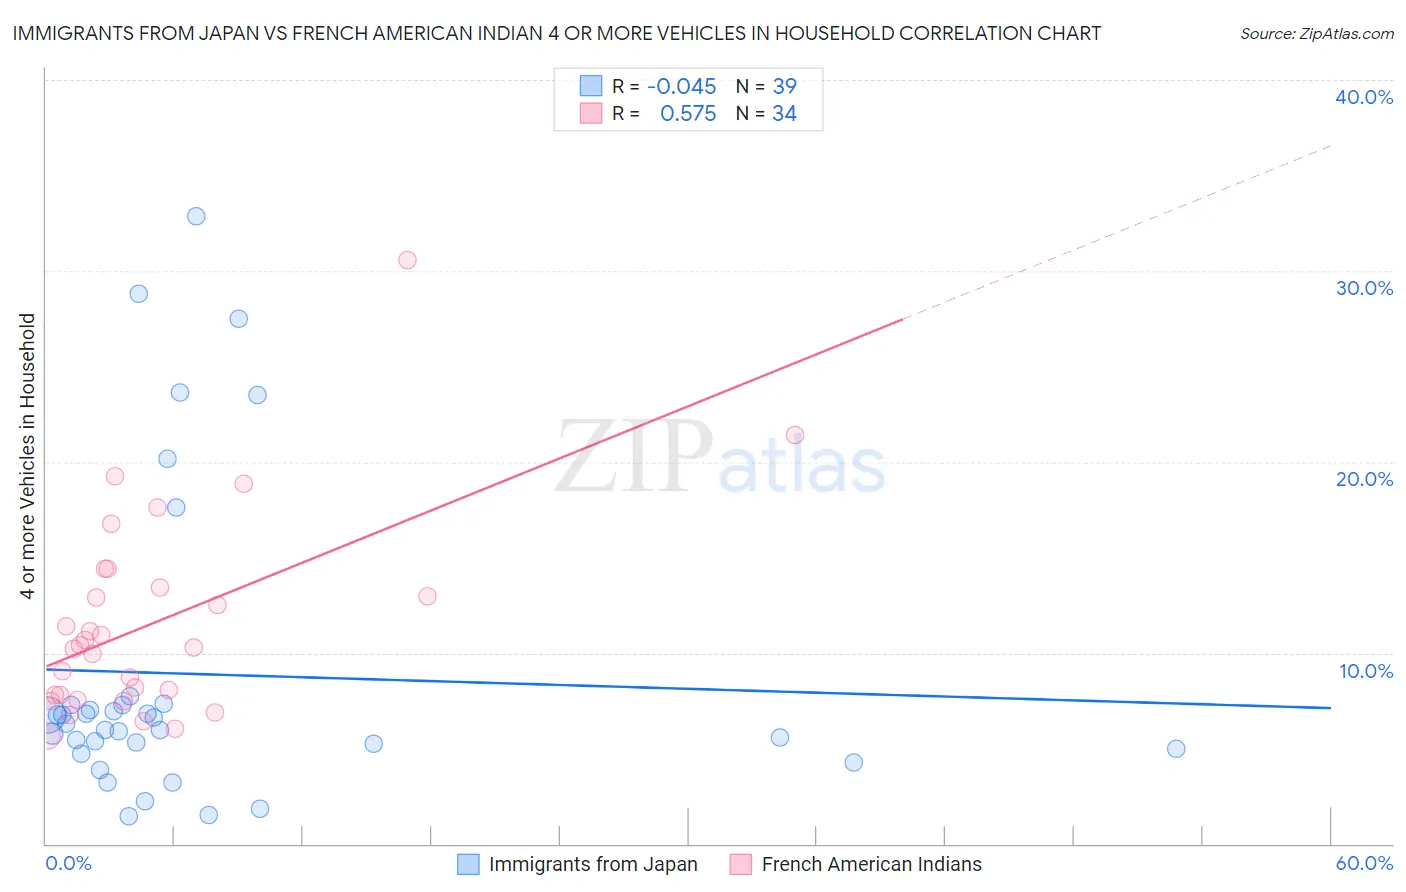
Immigrants from Japan vs French American Indian 4 or more Vehicles in Household Correlation Chart
The statistical analysis conducted on geographies consisting of 338,505,499 people shows no correlation between the proportion of Immigrants from Japan and percentage of households with 4 or more vehicles available in the United States with a correlation coefficient (R) of -0.045 and weighted average of 6.3%. Similarly, the statistical analysis conducted on geographies consisting of 131,879,224 people shows a substantial positive correlation between the proportion of French American Indians and percentage of households with 4 or more vehicles available in the United States with a correlation coefficient (R) of 0.575 and weighted average of 6.8%, a difference of 8.6%.
4 or more Vehicles in Household Correlation Summary
| Measurement | Immigrants from Japan | French American Indian |
| Minimum | 1.5% | 5.6% |
| Maximum | 32.8% | 30.6% |
| Range | 31.4% | 25.0% |
| Mean | 8.9% | 11.6% |
| Median | 6.3% | 10.3% |
| Interquartile 25% (IQ1) | 5.0% | 7.8% |
| Interquartile 75% (IQ3) | 7.3% | 13.4% |
| Interquartile Range (IQR) | 2.3% | 5.6% |
| Standard Deviation (Sample) | 8.0% | 5.3% |
| Standard Deviation (Population) | 7.9% | 5.2% |
Similar Demographics by 4 or more Vehicles in Household
Demographics Similar to Immigrants from Japan by 4 or more Vehicles in Household
In terms of 4 or more vehicles in household, the demographic groups most similar to Immigrants from Japan are Syrian (6.3%, a difference of 0.11%), Belizean (6.3%, a difference of 0.15%), Yugoslavian (6.3%, a difference of 0.20%), South American Indian (6.3%, a difference of 0.25%), and Slovak (6.3%, a difference of 0.39%).
| Demographics | Rating | Rank | 4 or more Vehicles in Household |
| Immigrants | Lebanon | 51.7 /100 | #172 | Average 6.3% |
| Slovenes | 51.1 /100 | #173 | Average 6.3% |
| Lithuanians | 50.0 /100 | #174 | Average 6.3% |
| Immigrants | Western Europe | 48.8 /100 | #175 | Average 6.3% |
| Ukrainians | 47.6 /100 | #176 | Average 6.3% |
| Slovaks | 46.9 /100 | #177 | Average 6.3% |
| Belizeans | 44.5 /100 | #178 | Average 6.3% |
| Immigrants | Japan | 43.1 /100 | #179 | Average 6.3% |
| Syrians | 42.0 /100 | #180 | Average 6.3% |
| Yugoslavians | 41.1 /100 | #181 | Average 6.3% |
| South American Indians | 40.7 /100 | #182 | Average 6.3% |
| Immigrants | Burma/Myanmar | 37.5 /100 | #183 | Fair 6.2% |
| Iraqis | 37.3 /100 | #184 | Fair 6.2% |
| Thais | 36.9 /100 | #185 | Fair 6.2% |
| Immigrants | Northern Europe | 36.8 /100 | #186 | Fair 6.2% |
Demographics Similar to French American Indians by 4 or more Vehicles in Household
In terms of 4 or more vehicles in household, the demographic groups most similar to French American Indians are Burmese (6.8%, a difference of 0.0%), Immigrants from Guatemala (6.8%, a difference of 0.020%), Costa Rican (6.8%, a difference of 0.11%), Tlingit-Haida (6.8%, a difference of 0.28%), and Bolivian (6.8%, a difference of 0.34%).
| Demographics | Rating | Rank | 4 or more Vehicles in Household |
| Aleuts | 97.0 /100 | #111 | Exceptional 6.9% |
| Hopi | 97.0 /100 | #112 | Exceptional 6.9% |
| Canadians | 96.4 /100 | #113 | Exceptional 6.9% |
| Bolivians | 96.3 /100 | #114 | Exceptional 6.8% |
| Tlingit-Haida | 96.2 /100 | #115 | Exceptional 6.8% |
| Immigrants | Guatemala | 95.8 /100 | #116 | Exceptional 6.8% |
| Burmese | 95.7 /100 | #117 | Exceptional 6.8% |
| French American Indians | 95.7 /100 | #118 | Exceptional 6.8% |
| Costa Ricans | 95.5 /100 | #119 | Exceptional 6.8% |
| Comanche | 94.8 /100 | #120 | Exceptional 6.8% |
| Immigrants | Germany | 94.7 /100 | #121 | Exceptional 6.8% |
| Immigrants | Nicaragua | 94.7 /100 | #122 | Exceptional 6.8% |
| Immigrants | Immigrants | 94.6 /100 | #123 | Exceptional 6.8% |
| Immigrants | Asia | 94.4 /100 | #124 | Exceptional 6.8% |
| Austrians | 94.1 /100 | #125 | Exceptional 6.8% |