Immigrants from Japan vs Immigrants from Dominican Republic 4 or more Vehicles in Household
COMPARE
Immigrants from Japan
Immigrants from Dominican Republic
4 or more Vehicles in Household
4 or more Vehicles in Household Comparison
Immigrants from Japan
Immigrants from Dominican Republic
6.3%
4 OR MORE VEHICLES IN HOUSEHOLD
43.1/ 100
METRIC RATING
179th/ 347
METRIC RANK
3.3%
4 OR MORE VEHICLES IN HOUSEHOLD
0.0/ 100
METRIC RATING
345th/ 347
METRIC RANK
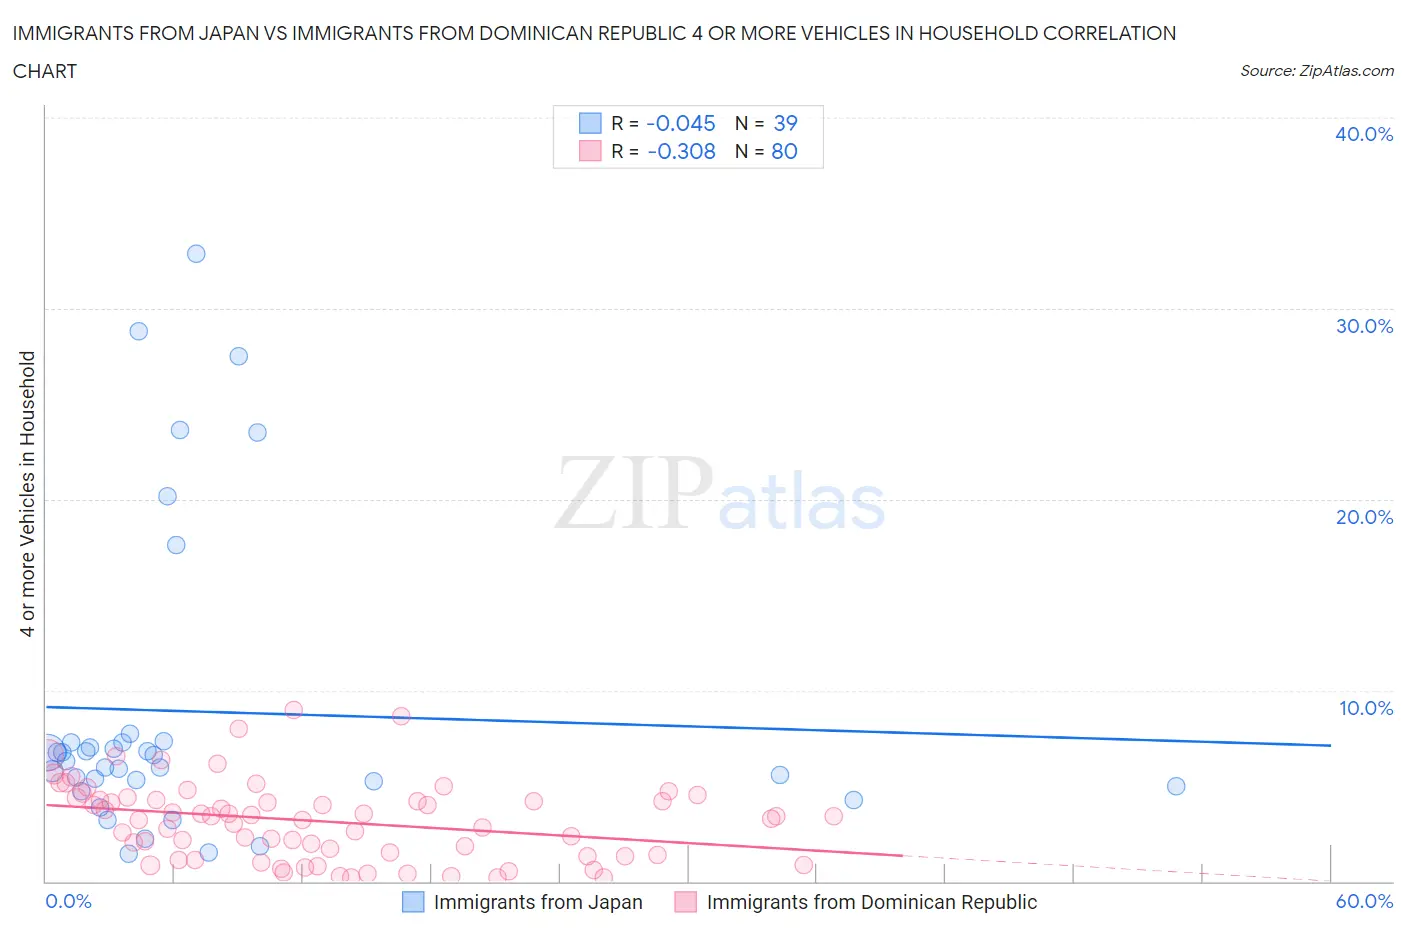
Immigrants from Japan vs Immigrants from Dominican Republic 4 or more Vehicles in Household Correlation Chart
The statistical analysis conducted on geographies consisting of 338,505,499 people shows no correlation between the proportion of Immigrants from Japan and percentage of households with 4 or more vehicles available in the United States with a correlation coefficient (R) of -0.045 and weighted average of 6.3%. Similarly, the statistical analysis conducted on geographies consisting of 273,543,837 people shows a mild negative correlation between the proportion of Immigrants from Dominican Republic and percentage of households with 4 or more vehicles available in the United States with a correlation coefficient (R) of -0.308 and weighted average of 3.3%, a difference of 92.3%.
4 or more Vehicles in Household Correlation Summary
| Measurement | Immigrants from Japan | Immigrants from Dominican Republic |
| Minimum | 1.5% | 0.17% |
| Maximum | 32.8% | 9.0% |
| Range | 31.4% | 8.8% |
| Mean | 8.9% | 3.1% |
| Median | 6.3% | 3.3% |
| Interquartile 25% (IQ1) | 5.0% | 1.3% |
| Interquartile 75% (IQ3) | 7.3% | 4.3% |
| Interquartile Range (IQR) | 2.3% | 3.0% |
| Standard Deviation (Sample) | 8.0% | 2.0% |
| Standard Deviation (Population) | 7.9% | 2.0% |
Similar Demographics by 4 or more Vehicles in Household
Demographics Similar to Immigrants from Japan by 4 or more Vehicles in Household
In terms of 4 or more vehicles in household, the demographic groups most similar to Immigrants from Japan are Syrian (6.3%, a difference of 0.11%), Belizean (6.3%, a difference of 0.15%), Yugoslavian (6.3%, a difference of 0.20%), South American Indian (6.3%, a difference of 0.25%), and Slovak (6.3%, a difference of 0.39%).
| Demographics | Rating | Rank | 4 or more Vehicles in Household |
| Immigrants | Lebanon | 51.7 /100 | #172 | Average 6.3% |
| Slovenes | 51.1 /100 | #173 | Average 6.3% |
| Lithuanians | 50.0 /100 | #174 | Average 6.3% |
| Immigrants | Western Europe | 48.8 /100 | #175 | Average 6.3% |
| Ukrainians | 47.6 /100 | #176 | Average 6.3% |
| Slovaks | 46.9 /100 | #177 | Average 6.3% |
| Belizeans | 44.5 /100 | #178 | Average 6.3% |
| Immigrants | Japan | 43.1 /100 | #179 | Average 6.3% |
| Syrians | 42.0 /100 | #180 | Average 6.3% |
| Yugoslavians | 41.1 /100 | #181 | Average 6.3% |
| South American Indians | 40.7 /100 | #182 | Average 6.3% |
| Immigrants | Burma/Myanmar | 37.5 /100 | #183 | Fair 6.2% |
| Iraqis | 37.3 /100 | #184 | Fair 6.2% |
| Thais | 36.9 /100 | #185 | Fair 6.2% |
| Immigrants | Northern Europe | 36.8 /100 | #186 | Fair 6.2% |
Demographics Similar to Immigrants from Dominican Republic by 4 or more Vehicles in Household
In terms of 4 or more vehicles in household, the demographic groups most similar to Immigrants from Dominican Republic are Immigrants from Guyana (3.4%, a difference of 4.1%), British West Indian (3.5%, a difference of 5.7%), Guyanese (3.5%, a difference of 6.7%), Dominican (3.5%, a difference of 7.5%), and Immigrants from St. Vincent and the Grenadines (3.0%, a difference of 10.0%).
| Demographics | Rating | Rank | 4 or more Vehicles in Household |
| Immigrants | Albania | 0.0 /100 | #333 | Tragic 4.1% |
| Immigrants | Trinidad and Tobago | 0.0 /100 | #334 | Tragic 4.1% |
| Barbadians | 0.0 /100 | #335 | Tragic 3.9% |
| Immigrants | Bangladesh | 0.0 /100 | #336 | Tragic 3.9% |
| Vietnamese | 0.0 /100 | #337 | Tragic 3.9% |
| Immigrants | Cabo Verde | 0.0 /100 | #338 | Tragic 3.8% |
| Immigrants | Uzbekistan | 0.0 /100 | #339 | Tragic 3.6% |
| Immigrants | Barbados | 0.0 /100 | #340 | Tragic 3.6% |
| Dominicans | 0.0 /100 | #341 | Tragic 3.5% |
| Guyanese | 0.0 /100 | #342 | Tragic 3.5% |
| British West Indians | 0.0 /100 | #343 | Tragic 3.5% |
| Immigrants | Guyana | 0.0 /100 | #344 | Tragic 3.4% |
| Immigrants | Dominican Republic | 0.0 /100 | #345 | Tragic 3.3% |
| Immigrants | St. Vincent and the Grenadines | 0.0 /100 | #346 | Tragic 3.0% |
| Immigrants | Grenada | 0.0 /100 | #347 | Tragic 2.7% |