Immigrants from Japan vs West Indian 4 or more Vehicles in Household
COMPARE
Immigrants from Japan
West Indian
4 or more Vehicles in Household
4 or more Vehicles in Household Comparison
Immigrants from Japan
West Indians
6.3%
4 OR MORE VEHICLES IN HOUSEHOLD
43.1/ 100
METRIC RATING
179th/ 347
METRIC RANK
4.2%
4 OR MORE VEHICLES IN HOUSEHOLD
0.0/ 100
METRIC RATING
331st/ 347
METRIC RANK
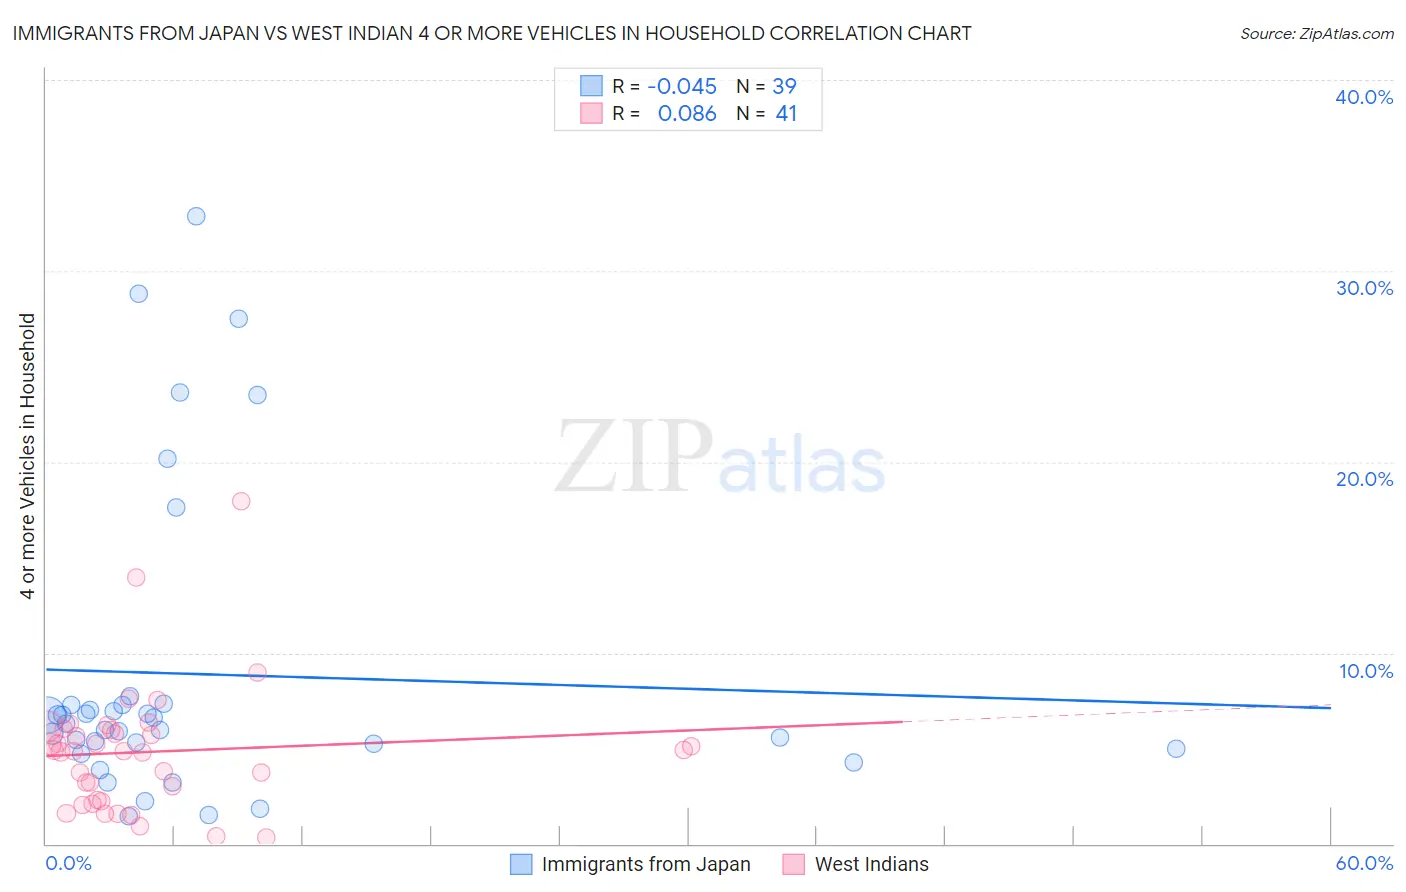
Immigrants from Japan vs West Indian 4 or more Vehicles in Household Correlation Chart
The statistical analysis conducted on geographies consisting of 338,505,499 people shows no correlation between the proportion of Immigrants from Japan and percentage of households with 4 or more vehicles available in the United States with a correlation coefficient (R) of -0.045 and weighted average of 6.3%. Similarly, the statistical analysis conducted on geographies consisting of 252,612,993 people shows a slight positive correlation between the proportion of West Indians and percentage of households with 4 or more vehicles available in the United States with a correlation coefficient (R) of 0.086 and weighted average of 4.2%, a difference of 48.7%.
4 or more Vehicles in Household Correlation Summary
| Measurement | Immigrants from Japan | West Indian |
| Minimum | 1.5% | 0.34% |
| Maximum | 32.8% | 17.9% |
| Range | 31.4% | 17.6% |
| Mean | 8.9% | 4.8% |
| Median | 6.3% | 4.9% |
| Interquartile 25% (IQ1) | 5.0% | 2.3% |
| Interquartile 75% (IQ3) | 7.3% | 6.0% |
| Interquartile Range (IQR) | 2.3% | 3.7% |
| Standard Deviation (Sample) | 8.0% | 3.3% |
| Standard Deviation (Population) | 7.9% | 3.3% |
Similar Demographics by 4 or more Vehicles in Household
Demographics Similar to Immigrants from Japan by 4 or more Vehicles in Household
In terms of 4 or more vehicles in household, the demographic groups most similar to Immigrants from Japan are Syrian (6.3%, a difference of 0.11%), Belizean (6.3%, a difference of 0.15%), Yugoslavian (6.3%, a difference of 0.20%), South American Indian (6.3%, a difference of 0.25%), and Slovak (6.3%, a difference of 0.39%).
| Demographics | Rating | Rank | 4 or more Vehicles in Household |
| Immigrants | Lebanon | 51.7 /100 | #172 | Average 6.3% |
| Slovenes | 51.1 /100 | #173 | Average 6.3% |
| Lithuanians | 50.0 /100 | #174 | Average 6.3% |
| Immigrants | Western Europe | 48.8 /100 | #175 | Average 6.3% |
| Ukrainians | 47.6 /100 | #176 | Average 6.3% |
| Slovaks | 46.9 /100 | #177 | Average 6.3% |
| Belizeans | 44.5 /100 | #178 | Average 6.3% |
| Immigrants | Japan | 43.1 /100 | #179 | Average 6.3% |
| Syrians | 42.0 /100 | #180 | Average 6.3% |
| Yugoslavians | 41.1 /100 | #181 | Average 6.3% |
| South American Indians | 40.7 /100 | #182 | Average 6.3% |
| Immigrants | Burma/Myanmar | 37.5 /100 | #183 | Fair 6.2% |
| Iraqis | 37.3 /100 | #184 | Fair 6.2% |
| Thais | 36.9 /100 | #185 | Fair 6.2% |
| Immigrants | Northern Europe | 36.8 /100 | #186 | Fair 6.2% |
Demographics Similar to West Indians by 4 or more Vehicles in Household
In terms of 4 or more vehicles in household, the demographic groups most similar to West Indians are Immigrants from Ecuador (4.2%, a difference of 0.26%), Immigrants from Senegal (4.2%, a difference of 0.46%), Trinidadian and Tobagonian (4.3%, a difference of 0.73%), Immigrants from Dominica (4.2%, a difference of 0.90%), and Senegalese (4.3%, a difference of 2.3%).
| Demographics | Rating | Rank | 4 or more Vehicles in Household |
| Soviet Union | 0.0 /100 | #324 | Tragic 4.4% |
| Immigrants | Jamaica | 0.0 /100 | #325 | Tragic 4.4% |
| Cape Verdeans | 0.0 /100 | #326 | Tragic 4.4% |
| Senegalese | 0.0 /100 | #327 | Tragic 4.3% |
| Trinidadians and Tobagonians | 0.0 /100 | #328 | Tragic 4.3% |
| Immigrants | Senegal | 0.0 /100 | #329 | Tragic 4.2% |
| Immigrants | Ecuador | 0.0 /100 | #330 | Tragic 4.2% |
| West Indians | 0.0 /100 | #331 | Tragic 4.2% |
| Immigrants | Dominica | 0.0 /100 | #332 | Tragic 4.2% |
| Immigrants | Albania | 0.0 /100 | #333 | Tragic 4.1% |
| Immigrants | Trinidad and Tobago | 0.0 /100 | #334 | Tragic 4.1% |
| Barbadians | 0.0 /100 | #335 | Tragic 3.9% |
| Immigrants | Bangladesh | 0.0 /100 | #336 | Tragic 3.9% |
| Vietnamese | 0.0 /100 | #337 | Tragic 3.9% |
| Immigrants | Cabo Verde | 0.0 /100 | #338 | Tragic 3.8% |