Immigrants from Japan vs Northern European 4 or more Vehicles in Household
COMPARE
Immigrants from Japan
Northern European
4 or more Vehicles in Household
4 or more Vehicles in Household Comparison
Immigrants from Japan
Northern Europeans
6.3%
4 OR MORE VEHICLES IN HOUSEHOLD
43.1/ 100
METRIC RATING
179th/ 347
METRIC RANK
7.3%
4 OR MORE VEHICLES IN HOUSEHOLD
99.8/ 100
METRIC RATING
82nd/ 347
METRIC RANK
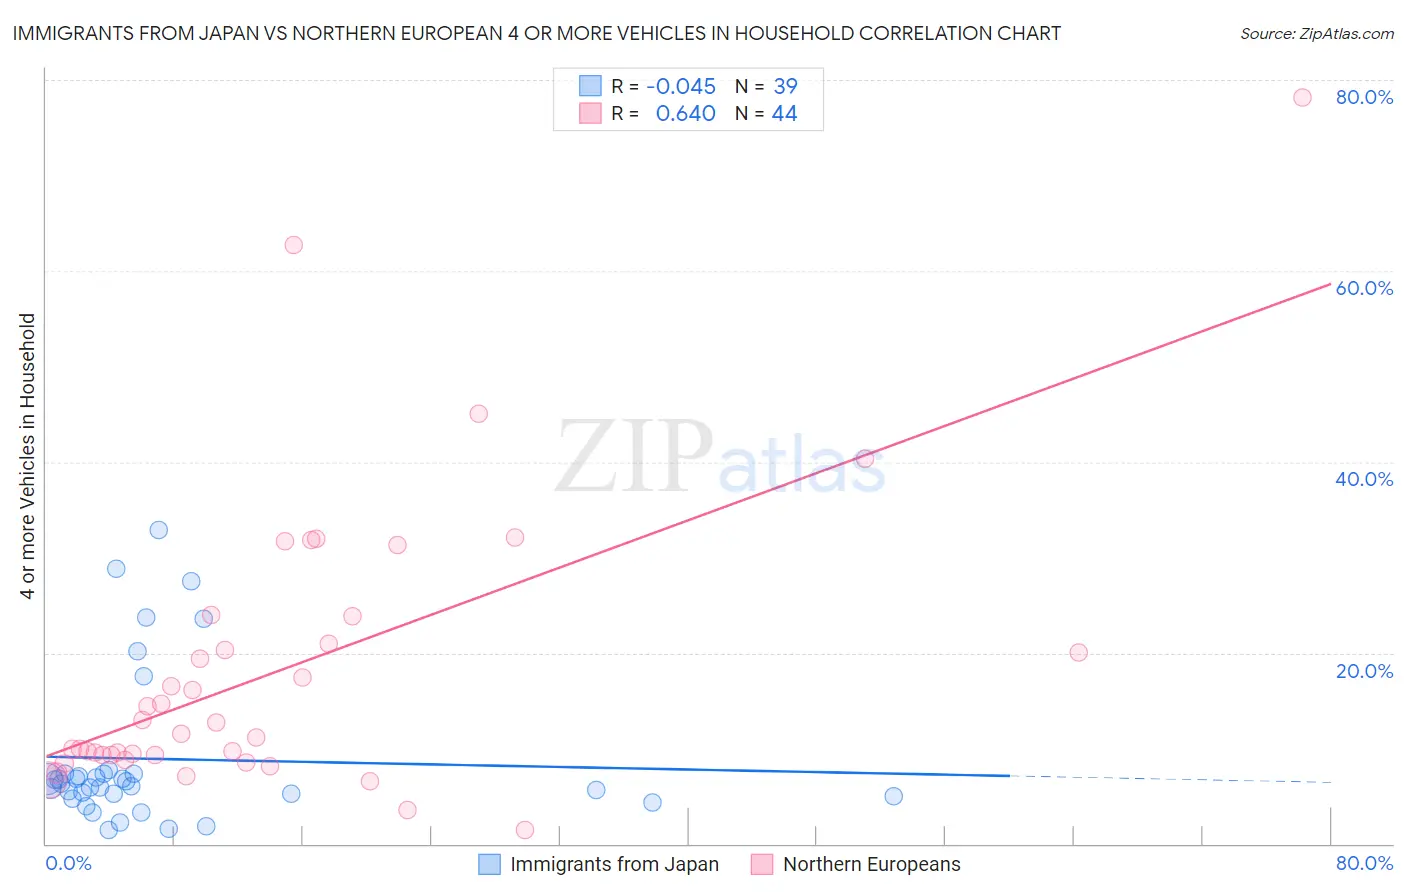
Immigrants from Japan vs Northern European 4 or more Vehicles in Household Correlation Chart
The statistical analysis conducted on geographies consisting of 338,505,499 people shows no correlation between the proportion of Immigrants from Japan and percentage of households with 4 or more vehicles available in the United States with a correlation coefficient (R) of -0.045 and weighted average of 6.3%. Similarly, the statistical analysis conducted on geographies consisting of 404,763,195 people shows a significant positive correlation between the proportion of Northern Europeans and percentage of households with 4 or more vehicles available in the United States with a correlation coefficient (R) of 0.640 and weighted average of 7.3%, a difference of 16.0%.
4 or more Vehicles in Household Correlation Summary
| Measurement | Immigrants from Japan | Northern European |
| Minimum | 1.5% | 1.5% |
| Maximum | 32.8% | 78.2% |
| Range | 31.4% | 76.8% |
| Mean | 8.9% | 18.3% |
| Median | 6.3% | 12.1% |
| Interquartile 25% (IQ1) | 5.0% | 9.3% |
| Interquartile 75% (IQ3) | 7.3% | 22.4% |
| Interquartile Range (IQR) | 2.3% | 13.2% |
| Standard Deviation (Sample) | 8.0% | 15.3% |
| Standard Deviation (Population) | 7.9% | 15.2% |
Similar Demographics by 4 or more Vehicles in Household
Demographics Similar to Immigrants from Japan by 4 or more Vehicles in Household
In terms of 4 or more vehicles in household, the demographic groups most similar to Immigrants from Japan are Syrian (6.3%, a difference of 0.11%), Belizean (6.3%, a difference of 0.15%), Yugoslavian (6.3%, a difference of 0.20%), South American Indian (6.3%, a difference of 0.25%), and Slovak (6.3%, a difference of 0.39%).
| Demographics | Rating | Rank | 4 or more Vehicles in Household |
| Immigrants | Lebanon | 51.7 /100 | #172 | Average 6.3% |
| Slovenes | 51.1 /100 | #173 | Average 6.3% |
| Lithuanians | 50.0 /100 | #174 | Average 6.3% |
| Immigrants | Western Europe | 48.8 /100 | #175 | Average 6.3% |
| Ukrainians | 47.6 /100 | #176 | Average 6.3% |
| Slovaks | 46.9 /100 | #177 | Average 6.3% |
| Belizeans | 44.5 /100 | #178 | Average 6.3% |
| Immigrants | Japan | 43.1 /100 | #179 | Average 6.3% |
| Syrians | 42.0 /100 | #180 | Average 6.3% |
| Yugoslavians | 41.1 /100 | #181 | Average 6.3% |
| South American Indians | 40.7 /100 | #182 | Average 6.3% |
| Immigrants | Burma/Myanmar | 37.5 /100 | #183 | Fair 6.2% |
| Iraqis | 37.3 /100 | #184 | Fair 6.2% |
| Thais | 36.9 /100 | #185 | Fair 6.2% |
| Immigrants | Northern Europe | 36.8 /100 | #186 | Fair 6.2% |
Demographics Similar to Northern Europeans by 4 or more Vehicles in Household
In terms of 4 or more vehicles in household, the demographic groups most similar to Northern Europeans are Potawatomi (7.3%, a difference of 0.12%), Finnish (7.3%, a difference of 0.20%), Afghan (7.3%, a difference of 0.44%), Cree (7.2%, a difference of 0.61%), and Alaska Native (7.3%, a difference of 0.76%).
| Demographics | Rating | Rank | 4 or more Vehicles in Household |
| Immigrants | Cambodia | 99.9 /100 | #75 | Exceptional 7.4% |
| Laotians | 99.9 /100 | #76 | Exceptional 7.4% |
| Apache | 99.9 /100 | #77 | Exceptional 7.4% |
| Whites/Caucasians | 99.8 /100 | #78 | Exceptional 7.4% |
| Czechs | 99.8 /100 | #79 | Exceptional 7.4% |
| Alaska Natives | 99.8 /100 | #80 | Exceptional 7.3% |
| Finns | 99.8 /100 | #81 | Exceptional 7.3% |
| Northern Europeans | 99.8 /100 | #82 | Exceptional 7.3% |
| Potawatomi | 99.7 /100 | #83 | Exceptional 7.3% |
| Afghans | 99.7 /100 | #84 | Exceptional 7.3% |
| Cree | 99.7 /100 | #85 | Exceptional 7.2% |
| Immigrants | Indonesia | 99.6 /100 | #86 | Exceptional 7.2% |
| Delaware | 99.6 /100 | #87 | Exceptional 7.2% |
| Immigrants | Nonimmigrants | 99.6 /100 | #88 | Exceptional 7.2% |
| British | 99.6 /100 | #89 | Exceptional 7.2% |