Immigrants from Iraq vs Immigrants from Indonesia 3 or more Vehicles in Household
COMPARE
Immigrants from Iraq
Immigrants from Indonesia
3 or more Vehicles in Household
3 or more Vehicles in Household Comparison
Immigrants from Iraq
Immigrants from Indonesia
20.2%
3 OR MORE VEHICLES IN HOUSEHOLD
87.1/ 100
METRIC RATING
137th/ 347
METRIC RANK
21.1%
3 OR MORE VEHICLES IN HOUSEHOLD
98.8/ 100
METRIC RATING
93rd/ 347
METRIC RANK
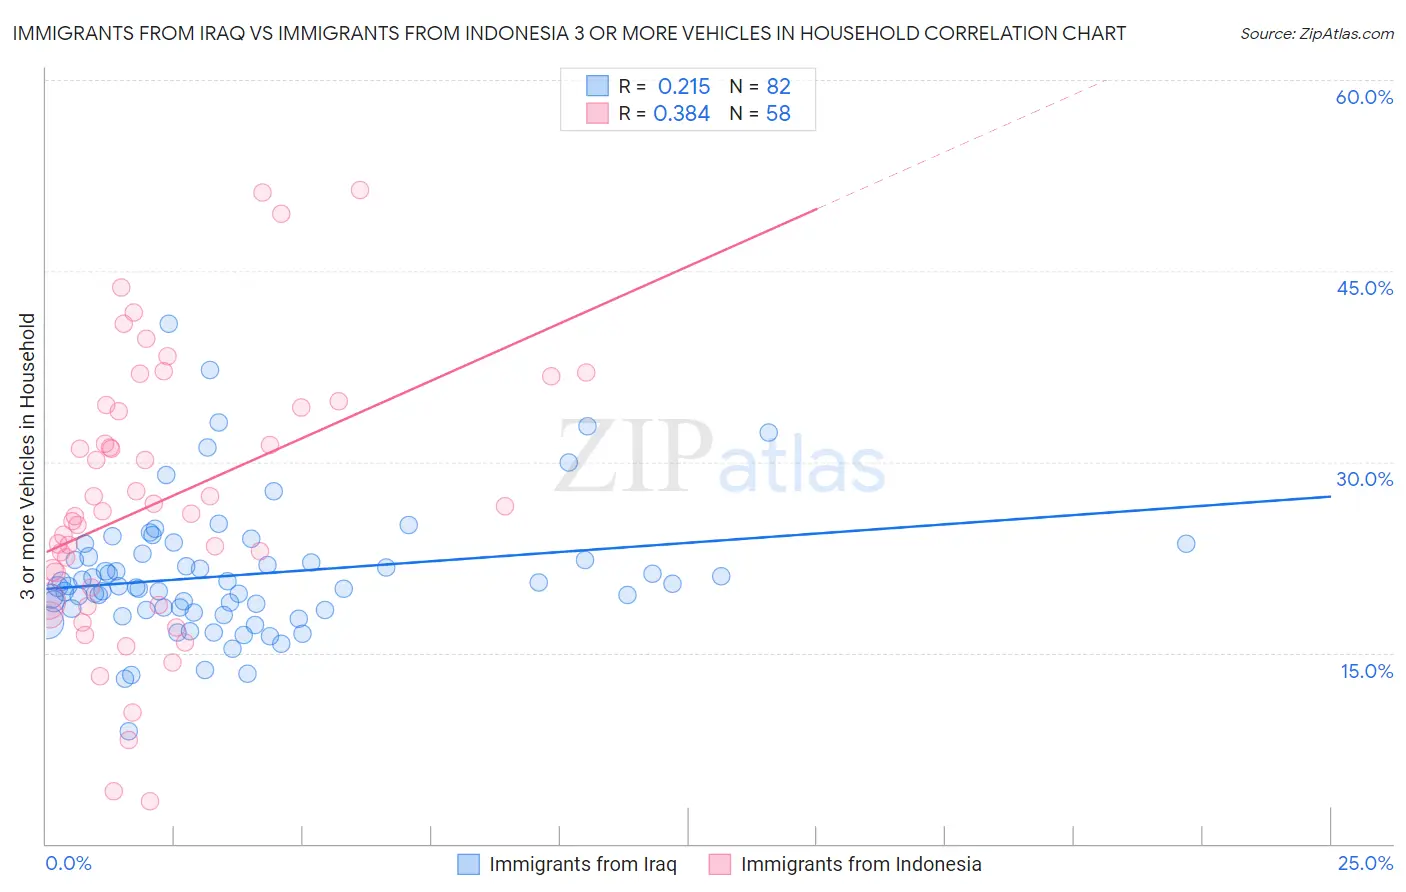
Immigrants from Iraq vs Immigrants from Indonesia 3 or more Vehicles in Household Correlation Chart
The statistical analysis conducted on geographies consisting of 194,713,443 people shows a weak positive correlation between the proportion of Immigrants from Iraq and percentage of households with 3 or more vehicles available in the United States with a correlation coefficient (R) of 0.215 and weighted average of 20.2%. Similarly, the statistical analysis conducted on geographies consisting of 215,673,146 people shows a mild positive correlation between the proportion of Immigrants from Indonesia and percentage of households with 3 or more vehicles available in the United States with a correlation coefficient (R) of 0.384 and weighted average of 21.1%, a difference of 4.5%.
3 or more Vehicles in Household Correlation Summary
| Measurement | Immigrants from Iraq | Immigrants from Indonesia |
| Minimum | 8.9% | 3.3% |
| Maximum | 40.8% | 51.4% |
| Range | 32.0% | 48.1% |
| Mean | 21.1% | 26.9% |
| Median | 20.2% | 26.0% |
| Interquartile 25% (IQ1) | 18.4% | 19.0% |
| Interquartile 75% (IQ3) | 22.5% | 34.3% |
| Interquartile Range (IQR) | 4.2% | 15.3% |
| Standard Deviation (Sample) | 5.2% | 10.7% |
| Standard Deviation (Population) | 5.2% | 10.6% |
Similar Demographics by 3 or more Vehicles in Household
Demographics Similar to Immigrants from Iraq by 3 or more Vehicles in Household
In terms of 3 or more vehicles in household, the demographic groups most similar to Immigrants from Iraq are Immigrants from Nicaragua (20.2%, a difference of 0.0%), Immigrants from India (20.2%, a difference of 0.010%), Polish (20.2%, a difference of 0.040%), Immigrants from North America (20.2%, a difference of 0.12%), and Aleut (20.2%, a difference of 0.12%).
| Demographics | Rating | Rank | 3 or more Vehicles in Household |
| Greeks | 88.6 /100 | #130 | Excellent 20.3% |
| Immigrants | Asia | 88.1 /100 | #131 | Excellent 20.2% |
| Immigrants | Canada | 87.8 /100 | #132 | Excellent 20.2% |
| Immigrants | North America | 87.8 /100 | #133 | Excellent 20.2% |
| Poles | 87.3 /100 | #134 | Excellent 20.2% |
| Immigrants | India | 87.2 /100 | #135 | Excellent 20.2% |
| Immigrants | Nicaragua | 87.1 /100 | #136 | Excellent 20.2% |
| Immigrants | Iraq | 87.1 /100 | #137 | Excellent 20.2% |
| Aleuts | 86.3 /100 | #138 | Excellent 20.2% |
| Slovenes | 85.5 /100 | #139 | Excellent 20.2% |
| French American Indians | 85.3 /100 | #140 | Excellent 20.1% |
| Ottawa | 84.9 /100 | #141 | Excellent 20.1% |
| Jordanians | 84.4 /100 | #142 | Excellent 20.1% |
| Lithuanians | 84.4 /100 | #143 | Excellent 20.1% |
| Iranians | 84.0 /100 | #144 | Excellent 20.1% |
Demographics Similar to Immigrants from Indonesia by 3 or more Vehicles in Household
In terms of 3 or more vehicles in household, the demographic groups most similar to Immigrants from Indonesia are Apache (21.2%, a difference of 0.20%), Immigrants from Cambodia (21.1%, a difference of 0.23%), Belgian (21.2%, a difference of 0.28%), Pakistani (21.0%, a difference of 0.37%), and Cree (21.0%, a difference of 0.46%).
| Demographics | Rating | Rank | 3 or more Vehicles in Household |
| Delaware | 99.6 /100 | #86 | Exceptional 21.5% |
| Immigrants | Azores | 99.5 /100 | #87 | Exceptional 21.5% |
| French | 99.4 /100 | #88 | Exceptional 21.4% |
| Marshallese | 99.2 /100 | #89 | Exceptional 21.3% |
| Immigrants | Afghanistan | 99.1 /100 | #90 | Exceptional 21.2% |
| Belgians | 98.9 /100 | #91 | Exceptional 21.2% |
| Apache | 98.9 /100 | #92 | Exceptional 21.2% |
| Immigrants | Indonesia | 98.8 /100 | #93 | Exceptional 21.1% |
| Immigrants | Cambodia | 98.6 /100 | #94 | Exceptional 21.1% |
| Pakistanis | 98.5 /100 | #95 | Exceptional 21.0% |
| Cree | 98.4 /100 | #96 | Exceptional 21.0% |
| Canadians | 98.3 /100 | #97 | Exceptional 21.0% |
| Hmong | 98.2 /100 | #98 | Exceptional 21.0% |
| Alaska Natives | 98.2 /100 | #99 | Exceptional 21.0% |
| Comanche | 98.2 /100 | #100 | Exceptional 21.0% |