Immigrants from Iran vs Pueblo 5th Grade
COMPARE
Immigrants from Iran
Pueblo
5th Grade
5th Grade Comparison
Immigrants from Iran
Pueblo
97.4%
5TH GRADE
59.5/ 100
METRIC RATING
162nd/ 347
METRIC RANK
97.8%
5TH GRADE
99.2/ 100
METRIC RATING
82nd/ 347
METRIC RANK
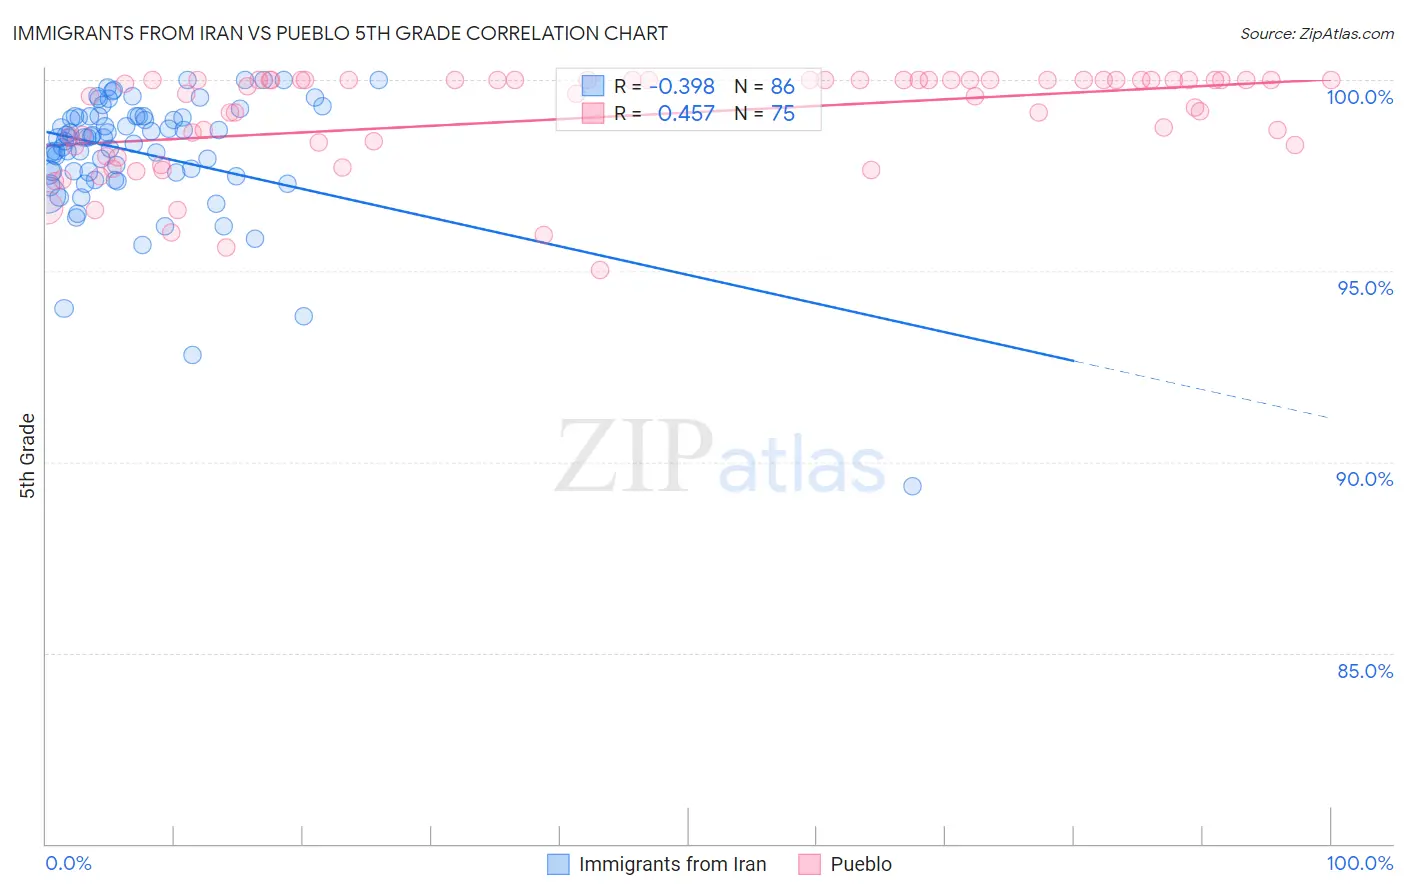
Immigrants from Iran vs Pueblo 5th Grade Correlation Chart
The statistical analysis conducted on geographies consisting of 279,867,553 people shows a mild negative correlation between the proportion of Immigrants from Iran and percentage of population with at least 5th grade education in the United States with a correlation coefficient (R) of -0.398 and weighted average of 97.4%. Similarly, the statistical analysis conducted on geographies consisting of 120,087,340 people shows a moderate positive correlation between the proportion of Pueblo and percentage of population with at least 5th grade education in the United States with a correlation coefficient (R) of 0.457 and weighted average of 97.8%, a difference of 0.46%.
5th Grade Correlation Summary
| Measurement | Immigrants from Iran | Pueblo |
| Minimum | 89.4% | 95.0% |
| Maximum | 100.0% | 100.0% |
| Range | 10.6% | 5.0% |
| Mean | 98.1% | 99.0% |
| Median | 98.5% | 99.8% |
| Interquartile 25% (IQ1) | 97.6% | 98.3% |
| Interquartile 75% (IQ3) | 99.0% | 100.0% |
| Interquartile Range (IQR) | 1.5% | 1.7% |
| Standard Deviation (Sample) | 1.7% | 1.3% |
| Standard Deviation (Population) | 1.6% | 1.3% |
Similar Demographics by 5th Grade
Demographics Similar to Immigrants from Iran by 5th Grade
In terms of 5th grade, the demographic groups most similar to Immigrants from Iran are Kenyan (97.4%, a difference of 0.0%), Ugandan (97.4%, a difference of 0.0%), Bermudan (97.4%, a difference of 0.0%), Marshallese (97.4%, a difference of 0.010%), and Immigrants from Poland (97.4%, a difference of 0.010%).
| Demographics | Rating | Rank | 5th Grade |
| Immigrants | Bosnia and Herzegovina | 71.0 /100 | #155 | Good 97.4% |
| French American Indians | 70.5 /100 | #156 | Good 97.4% |
| Immigrants | Jordan | 70.4 /100 | #157 | Good 97.4% |
| Albanians | 68.3 /100 | #158 | Good 97.4% |
| Immigrants | Italy | 65.2 /100 | #159 | Good 97.4% |
| Marshallese | 61.2 /100 | #160 | Good 97.4% |
| Kenyans | 59.7 /100 | #161 | Average 97.4% |
| Immigrants | Iran | 59.5 /100 | #162 | Average 97.4% |
| Ugandans | 58.9 /100 | #163 | Average 97.4% |
| Bermudans | 58.8 /100 | #164 | Average 97.4% |
| Immigrants | Poland | 57.9 /100 | #165 | Average 97.4% |
| Apache | 57.2 /100 | #166 | Average 97.4% |
| Immigrants | Belarus | 54.6 /100 | #167 | Average 97.3% |
| Chileans | 54.5 /100 | #168 | Average 97.3% |
| Immigrants | Korea | 54.1 /100 | #169 | Average 97.3% |
Demographics Similar to Pueblo by 5th Grade
In terms of 5th grade, the demographic groups most similar to Pueblo are Immigrants from India (97.8%, a difference of 0.0%), Icelander (97.8%, a difference of 0.0%), Osage (97.8%, a difference of 0.010%), Immigrants from Lithuania (97.8%, a difference of 0.010%), and Ukrainian (97.8%, a difference of 0.020%).
| Demographics | Rating | Rank | 5th Grade |
| Ukrainians | 99.3 /100 | #75 | Exceptional 97.8% |
| Immigrants | Netherlands | 99.3 /100 | #76 | Exceptional 97.8% |
| Immigrants | England | 99.3 /100 | #77 | Exceptional 97.8% |
| Osage | 99.3 /100 | #78 | Exceptional 97.8% |
| Immigrants | Lithuania | 99.2 /100 | #79 | Exceptional 97.8% |
| Immigrants | India | 99.2 /100 | #80 | Exceptional 97.8% |
| Icelanders | 99.2 /100 | #81 | Exceptional 97.8% |
| Pueblo | 99.2 /100 | #82 | Exceptional 97.8% |
| Zimbabweans | 99.0 /100 | #83 | Exceptional 97.8% |
| Potawatomi | 99.0 /100 | #84 | Exceptional 97.8% |
| Immigrants | Belgium | 99.0 /100 | #85 | Exceptional 97.8% |
| Cypriots | 98.9 /100 | #86 | Exceptional 97.8% |
| Immigrants | Australia | 98.8 /100 | #87 | Exceptional 97.8% |
| Shoshone | 98.8 /100 | #88 | Exceptional 97.8% |
| Immigrants | South Africa | 98.8 /100 | #89 | Exceptional 97.8% |