Immigrants from Nicaragua vs Pueblo 3 or more Vehicles in Household
COMPARE
Immigrants from Nicaragua
Pueblo
3 or more Vehicles in Household
3 or more Vehicles in Household Comparison
Immigrants from Nicaragua
Pueblo
20.2%
3 OR MORE VEHICLES IN HOUSEHOLD
87.1/ 100
METRIC RATING
136th/ 347
METRIC RANK
23.0%
3 OR MORE VEHICLES IN HOUSEHOLD
100.0/ 100
METRIC RATING
32nd/ 347
METRIC RANK
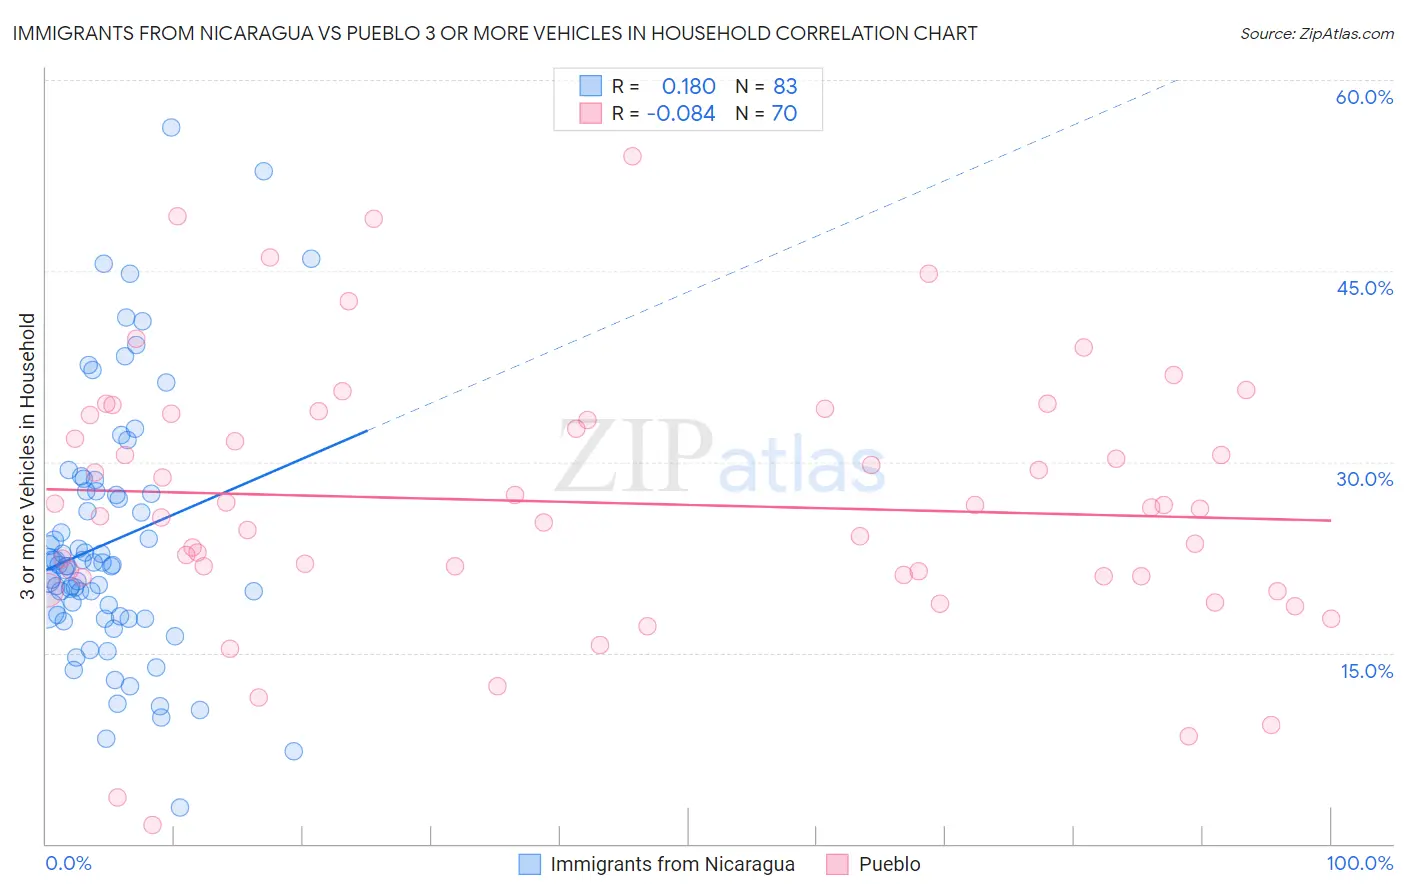
Immigrants from Nicaragua vs Pueblo 3 or more Vehicles in Household Correlation Chart
The statistical analysis conducted on geographies consisting of 236,311,792 people shows a poor positive correlation between the proportion of Immigrants from Nicaragua and percentage of households with 3 or more vehicles available in the United States with a correlation coefficient (R) of 0.180 and weighted average of 20.2%. Similarly, the statistical analysis conducted on geographies consisting of 120,063,355 people shows a slight negative correlation between the proportion of Pueblo and percentage of households with 3 or more vehicles available in the United States with a correlation coefficient (R) of -0.084 and weighted average of 23.0%, a difference of 14.0%.
3 or more Vehicles in Household Correlation Summary
| Measurement | Immigrants from Nicaragua | Pueblo |
| Minimum | 2.8% | 1.4% |
| Maximum | 56.2% | 54.0% |
| Range | 53.4% | 52.6% |
| Mean | 23.7% | 26.8% |
| Median | 21.9% | 26.3% |
| Interquartile 25% (IQ1) | 17.9% | 21.0% |
| Interquartile 75% (IQ3) | 27.6% | 33.7% |
| Interquartile Range (IQR) | 9.8% | 12.7% |
| Standard Deviation (Sample) | 10.0% | 10.2% |
| Standard Deviation (Population) | 9.9% | 10.1% |
Similar Demographics by 3 or more Vehicles in Household
Demographics Similar to Immigrants from Nicaragua by 3 or more Vehicles in Household
In terms of 3 or more vehicles in household, the demographic groups most similar to Immigrants from Nicaragua are Immigrants from Iraq (20.2%, a difference of 0.0%), Immigrants from India (20.2%, a difference of 0.010%), Polish (20.2%, a difference of 0.030%), Immigrants from Canada (20.2%, a difference of 0.12%), and Immigrants from North America (20.2%, a difference of 0.12%).
| Demographics | Rating | Rank | 3 or more Vehicles in Household |
| Zimbabweans | 88.7 /100 | #129 | Excellent 20.3% |
| Greeks | 88.6 /100 | #130 | Excellent 20.3% |
| Immigrants | Asia | 88.1 /100 | #131 | Excellent 20.2% |
| Immigrants | Canada | 87.8 /100 | #132 | Excellent 20.2% |
| Immigrants | North America | 87.8 /100 | #133 | Excellent 20.2% |
| Poles | 87.3 /100 | #134 | Excellent 20.2% |
| Immigrants | India | 87.2 /100 | #135 | Excellent 20.2% |
| Immigrants | Nicaragua | 87.1 /100 | #136 | Excellent 20.2% |
| Immigrants | Iraq | 87.1 /100 | #137 | Excellent 20.2% |
| Aleuts | 86.3 /100 | #138 | Excellent 20.2% |
| Slovenes | 85.5 /100 | #139 | Excellent 20.2% |
| French American Indians | 85.3 /100 | #140 | Excellent 20.1% |
| Ottawa | 84.9 /100 | #141 | Excellent 20.1% |
| Jordanians | 84.4 /100 | #142 | Excellent 20.1% |
| Lithuanians | 84.4 /100 | #143 | Excellent 20.1% |
Demographics Similar to Pueblo by 3 or more Vehicles in Household
In terms of 3 or more vehicles in household, the demographic groups most similar to Pueblo are Spanish American (23.0%, a difference of 0.060%), English (23.1%, a difference of 0.090%), Swiss (23.0%, a difference of 0.11%), Choctaw (23.0%, a difference of 0.13%), and Cherokee (23.0%, a difference of 0.17%).
| Demographics | Rating | Rank | 3 or more Vehicles in Household |
| Immigrants | Central America | 100.0 /100 | #25 | Exceptional 23.4% |
| Mexican American Indians | 100.0 /100 | #26 | Exceptional 23.3% |
| Guamanians/Chamorros | 100.0 /100 | #27 | Exceptional 23.2% |
| Lumbee | 100.0 /100 | #28 | Exceptional 23.1% |
| Spanish | 100.0 /100 | #29 | Exceptional 23.1% |
| Immigrants | South Eastern Asia | 100.0 /100 | #30 | Exceptional 23.1% |
| English | 100.0 /100 | #31 | Exceptional 23.1% |
| Pueblo | 100.0 /100 | #32 | Exceptional 23.0% |
| Spanish Americans | 100.0 /100 | #33 | Exceptional 23.0% |
| Swiss | 100.0 /100 | #34 | Exceptional 23.0% |
| Choctaw | 100.0 /100 | #35 | Exceptional 23.0% |
| Cherokee | 100.0 /100 | #36 | Exceptional 23.0% |
| Swedes | 100.0 /100 | #37 | Exceptional 23.0% |
| Dutch | 100.0 /100 | #38 | Exceptional 22.9% |
| Yaqui | 100.0 /100 | #39 | Exceptional 22.9% |