European vs Immigrants from Eastern Asia 3 or more Vehicles in Household
COMPARE
European
Immigrants from Eastern Asia
3 or more Vehicles in Household
3 or more Vehicles in Household Comparison
Europeans
Immigrants from Eastern Asia
22.9%
3 OR MORE VEHICLES IN HOUSEHOLD
100.0/ 100
METRIC RATING
40th/ 347
METRIC RANK
18.8%
3 OR MORE VEHICLES IN HOUSEHOLD
14.1/ 100
METRIC RATING
206th/ 347
METRIC RANK
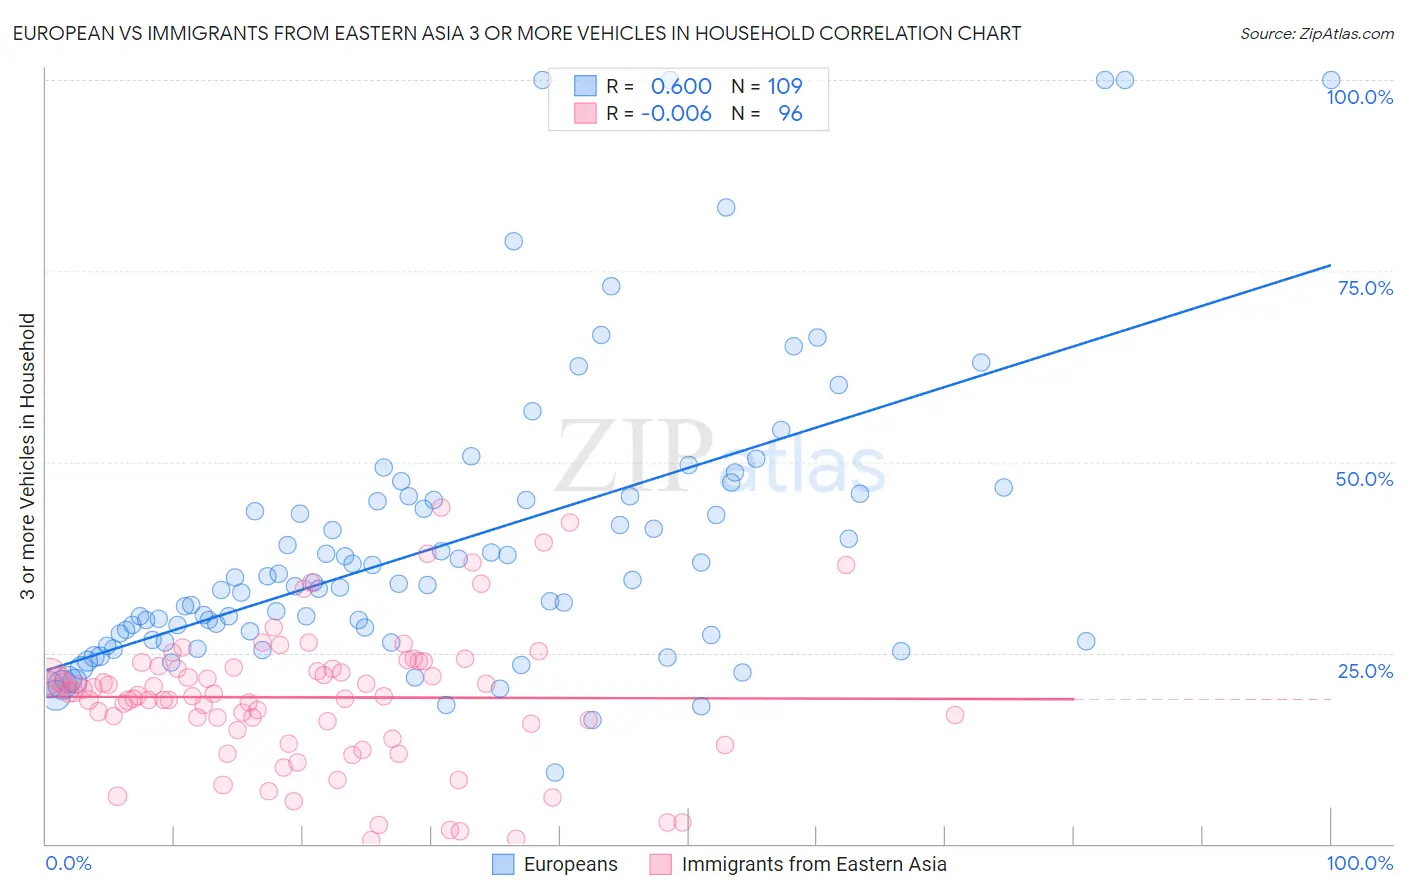
European vs Immigrants from Eastern Asia 3 or more Vehicles in Household Correlation Chart
The statistical analysis conducted on geographies consisting of 560,995,008 people shows a substantial positive correlation between the proportion of Europeans and percentage of households with 3 or more vehicles available in the United States with a correlation coefficient (R) of 0.600 and weighted average of 22.9%. Similarly, the statistical analysis conducted on geographies consisting of 499,168,797 people shows no correlation between the proportion of Immigrants from Eastern Asia and percentage of households with 3 or more vehicles available in the United States with a correlation coefficient (R) of -0.006 and weighted average of 18.8%, a difference of 21.3%.
3 or more Vehicles in Household Correlation Summary
| Measurement | European | Immigrants from Eastern Asia |
| Minimum | 9.3% | 0.54% |
| Maximum | 100.0% | 44.0% |
| Range | 90.7% | 43.5% |
| Mean | 39.1% | 19.2% |
| Median | 33.9% | 19.5% |
| Interquartile 25% (IQ1) | 26.6% | 15.3% |
| Interquartile 75% (IQ3) | 45.2% | 23.2% |
| Interquartile Range (IQR) | 18.7% | 7.9% |
| Standard Deviation (Sample) | 19.0% | 8.9% |
| Standard Deviation (Population) | 18.9% | 8.9% |
Similar Demographics by 3 or more Vehicles in Household
Demographics Similar to Europeans by 3 or more Vehicles in Household
In terms of 3 or more vehicles in household, the demographic groups most similar to Europeans are Yaqui (22.9%, a difference of 0.25%), Dutch (22.9%, a difference of 0.35%), German (22.7%, a difference of 0.47%), Native/Alaskan (22.7%, a difference of 0.47%), and Swedish (23.0%, a difference of 0.58%).
| Demographics | Rating | Rank | 3 or more Vehicles in Household |
| Spanish Americans | 100.0 /100 | #33 | Exceptional 23.0% |
| Swiss | 100.0 /100 | #34 | Exceptional 23.0% |
| Choctaw | 100.0 /100 | #35 | Exceptional 23.0% |
| Cherokee | 100.0 /100 | #36 | Exceptional 23.0% |
| Swedes | 100.0 /100 | #37 | Exceptional 23.0% |
| Dutch | 100.0 /100 | #38 | Exceptional 22.9% |
| Yaqui | 100.0 /100 | #39 | Exceptional 22.9% |
| Europeans | 100.0 /100 | #40 | Exceptional 22.9% |
| Germans | 100.0 /100 | #41 | Exceptional 22.7% |
| Natives/Alaskans | 100.0 /100 | #42 | Exceptional 22.7% |
| Osage | 100.0 /100 | #43 | Exceptional 22.7% |
| Cheyenne | 100.0 /100 | #44 | Exceptional 22.7% |
| Ute | 100.0 /100 | #45 | Exceptional 22.7% |
| Americans | 100.0 /100 | #46 | Exceptional 22.6% |
| Malaysians | 100.0 /100 | #47 | Exceptional 22.6% |
Demographics Similar to Immigrants from Eastern Asia by 3 or more Vehicles in Household
In terms of 3 or more vehicles in household, the demographic groups most similar to Immigrants from Eastern Asia are Russian (18.8%, a difference of 0.010%), Immigrants from Romania (18.9%, a difference of 0.080%), Immigrants from Chile (18.8%, a difference of 0.080%), Immigrants from Burma/Myanmar (18.8%, a difference of 0.090%), and Immigrants from Egypt (18.8%, a difference of 0.10%).
| Demographics | Rating | Rank | 3 or more Vehicles in Household |
| Immigrants | Norway | 19.0 /100 | #199 | Poor 19.0% |
| Argentineans | 18.2 /100 | #200 | Poor 18.9% |
| Arabs | 17.7 /100 | #201 | Poor 18.9% |
| Immigrants | Austria | 15.4 /100 | #202 | Poor 18.9% |
| Tohono O'odham | 14.8 /100 | #203 | Poor 18.9% |
| Immigrants | Romania | 14.6 /100 | #204 | Poor 18.9% |
| Russians | 14.2 /100 | #205 | Poor 18.8% |
| Immigrants | Eastern Asia | 14.1 /100 | #206 | Poor 18.8% |
| Immigrants | Chile | 13.6 /100 | #207 | Poor 18.8% |
| Immigrants | Burma/Myanmar | 13.6 /100 | #208 | Poor 18.8% |
| Immigrants | Egypt | 13.5 /100 | #209 | Poor 18.8% |
| Bulgarians | 13.1 /100 | #210 | Poor 18.8% |
| Immigrants | Kenya | 12.4 /100 | #211 | Poor 18.8% |
| Panamanians | 11.6 /100 | #212 | Poor 18.8% |
| Immigrants | Cuba | 11.6 /100 | #213 | Poor 18.8% |