Immigrants from Guyana vs Immigrants from Eastern Asia 4 or more Vehicles in Household
COMPARE
Immigrants from Guyana
Immigrants from Eastern Asia
4 or more Vehicles in Household
4 or more Vehicles in Household Comparison
Immigrants from Guyana
Immigrants from Eastern Asia
3.4%
4 OR MORE VEHICLES IN HOUSEHOLD
0.0/ 100
METRIC RATING
344th/ 347
METRIC RANK
6.2%
4 OR MORE VEHICLES IN HOUSEHOLD
33.3/ 100
METRIC RATING
189th/ 347
METRIC RANK
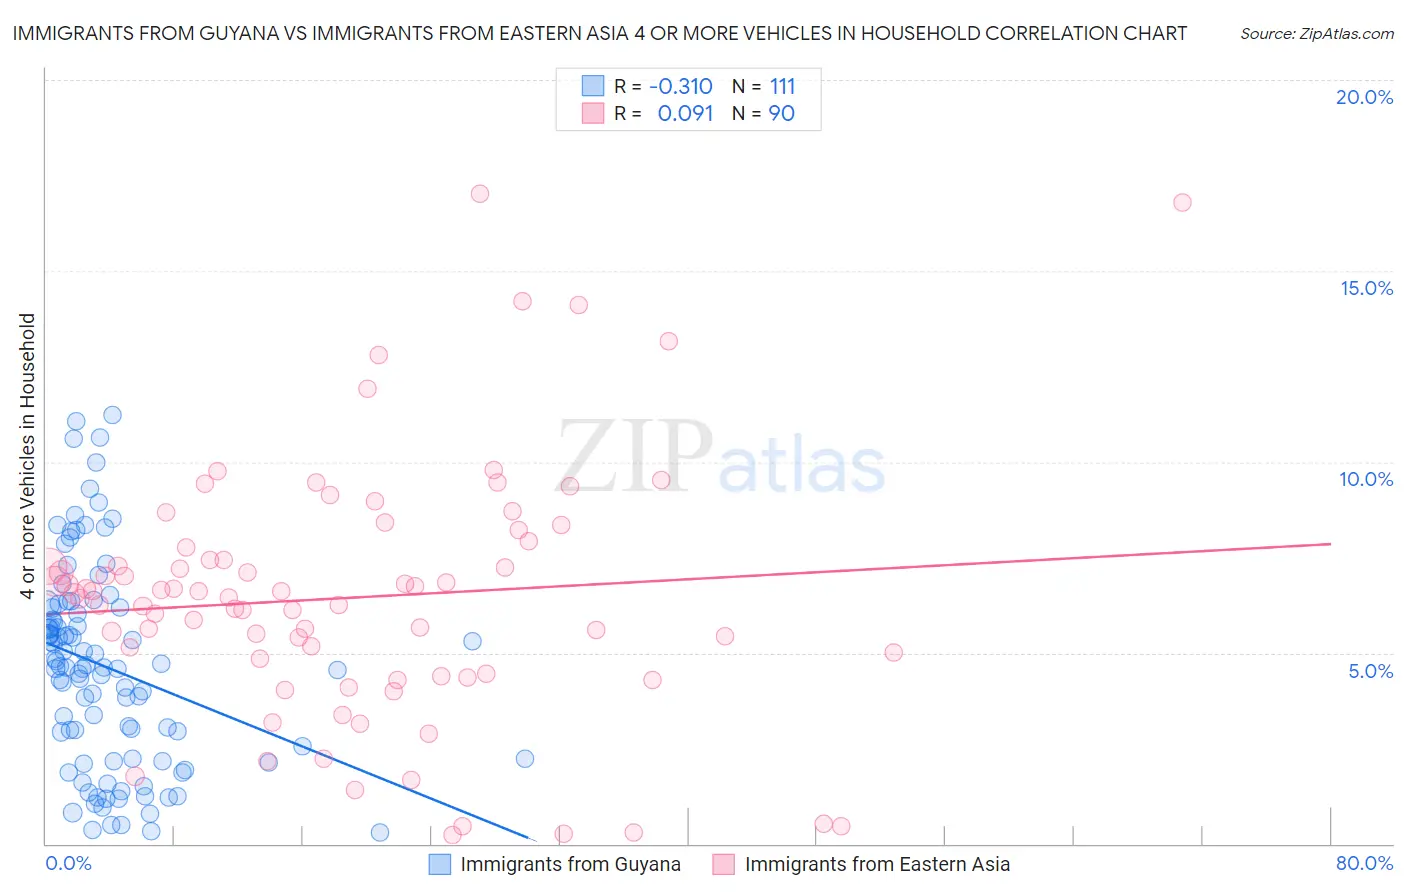
Immigrants from Guyana vs Immigrants from Eastern Asia 4 or more Vehicles in Household Correlation Chart
The statistical analysis conducted on geographies consisting of 182,580,983 people shows a mild negative correlation between the proportion of Immigrants from Guyana and percentage of households with 4 or more vehicles available in the United States with a correlation coefficient (R) of -0.310 and weighted average of 3.4%. Similarly, the statistical analysis conducted on geographies consisting of 497,144,085 people shows a slight positive correlation between the proportion of Immigrants from Eastern Asia and percentage of households with 4 or more vehicles available in the United States with a correlation coefficient (R) of 0.091 and weighted average of 6.2%, a difference of 82.9%.
4 or more Vehicles in Household Correlation Summary
| Measurement | Immigrants from Guyana | Immigrants from Eastern Asia |
| Minimum | 0.29% | 0.22% |
| Maximum | 11.2% | 17.0% |
| Range | 10.9% | 16.8% |
| Mean | 4.6% | 6.4% |
| Median | 4.6% | 6.5% |
| Interquartile 25% (IQ1) | 2.2% | 4.5% |
| Interquartile 75% (IQ3) | 6.2% | 7.8% |
| Interquartile Range (IQR) | 4.0% | 3.3% |
| Standard Deviation (Sample) | 2.6% | 3.3% |
| Standard Deviation (Population) | 2.6% | 3.3% |
Similar Demographics by 4 or more Vehicles in Household
Demographics Similar to Immigrants from Guyana by 4 or more Vehicles in Household
In terms of 4 or more vehicles in household, the demographic groups most similar to Immigrants from Guyana are British West Indian (3.5%, a difference of 1.6%), Guyanese (3.5%, a difference of 2.6%), Dominican (3.5%, a difference of 3.3%), Immigrants from Dominican Republic (3.3%, a difference of 4.1%), and Immigrants from Barbados (3.6%, a difference of 6.1%).
| Demographics | Rating | Rank | 4 or more Vehicles in Household |
| Immigrants | Albania | 0.0 /100 | #333 | Tragic 4.1% |
| Immigrants | Trinidad and Tobago | 0.0 /100 | #334 | Tragic 4.1% |
| Barbadians | 0.0 /100 | #335 | Tragic 3.9% |
| Immigrants | Bangladesh | 0.0 /100 | #336 | Tragic 3.9% |
| Vietnamese | 0.0 /100 | #337 | Tragic 3.9% |
| Immigrants | Cabo Verde | 0.0 /100 | #338 | Tragic 3.8% |
| Immigrants | Uzbekistan | 0.0 /100 | #339 | Tragic 3.6% |
| Immigrants | Barbados | 0.0 /100 | #340 | Tragic 3.6% |
| Dominicans | 0.0 /100 | #341 | Tragic 3.5% |
| Guyanese | 0.0 /100 | #342 | Tragic 3.5% |
| British West Indians | 0.0 /100 | #343 | Tragic 3.5% |
| Immigrants | Guyana | 0.0 /100 | #344 | Tragic 3.4% |
| Immigrants | Dominican Republic | 0.0 /100 | #345 | Tragic 3.3% |
| Immigrants | St. Vincent and the Grenadines | 0.0 /100 | #346 | Tragic 3.0% |
| Immigrants | Grenada | 0.0 /100 | #347 | Tragic 2.7% |
Demographics Similar to Immigrants from Eastern Asia by 4 or more Vehicles in Household
In terms of 4 or more vehicles in household, the demographic groups most similar to Immigrants from Eastern Asia are South African (6.2%, a difference of 0.12%), Kiowa (6.2%, a difference of 0.17%), Immigrants from South Africa (6.2%, a difference of 0.24%), Inupiat (6.2%, a difference of 0.30%), and Romanian (6.2%, a difference of 0.31%).
| Demographics | Rating | Rank | 4 or more Vehicles in Household |
| South American Indians | 40.7 /100 | #182 | Average 6.3% |
| Immigrants | Burma/Myanmar | 37.5 /100 | #183 | Fair 6.2% |
| Iraqis | 37.3 /100 | #184 | Fair 6.2% |
| Thais | 36.9 /100 | #185 | Fair 6.2% |
| Immigrants | Northern Europe | 36.8 /100 | #186 | Fair 6.2% |
| Immigrants | South Africa | 35.4 /100 | #187 | Fair 6.2% |
| Kiowa | 34.7 /100 | #188 | Fair 6.2% |
| Immigrants | Eastern Asia | 33.3 /100 | #189 | Fair 6.2% |
| South Africans | 32.2 /100 | #190 | Fair 6.2% |
| Inupiat | 30.7 /100 | #191 | Fair 6.2% |
| Romanians | 30.7 /100 | #192 | Fair 6.2% |
| Immigrants | Kuwait | 28.0 /100 | #193 | Fair 6.2% |
| Immigrants | Sweden | 27.0 /100 | #194 | Fair 6.2% |
| Argentineans | 27.0 /100 | #195 | Fair 6.2% |
| Tsimshian | 26.4 /100 | #196 | Fair 6.2% |