Immigrants from Guyana vs Scandinavian Unemployment Among Ages 16 to 19 years
COMPARE
Immigrants from Guyana
Scandinavian
Unemployment Among Ages 16 to 19 years
Unemployment Among Ages 16 to 19 years Comparison
Immigrants from Guyana
Scandinavians
25.5%
UNEMPLOYMENT AMONG AGES 16 TO 19 YEARS
0.0/ 100
METRIC RATING
337th/ 347
METRIC RANK
15.4%
UNEMPLOYMENT AMONG AGES 16 TO 19 YEARS
100.0/ 100
METRIC RATING
9th/ 347
METRIC RANK
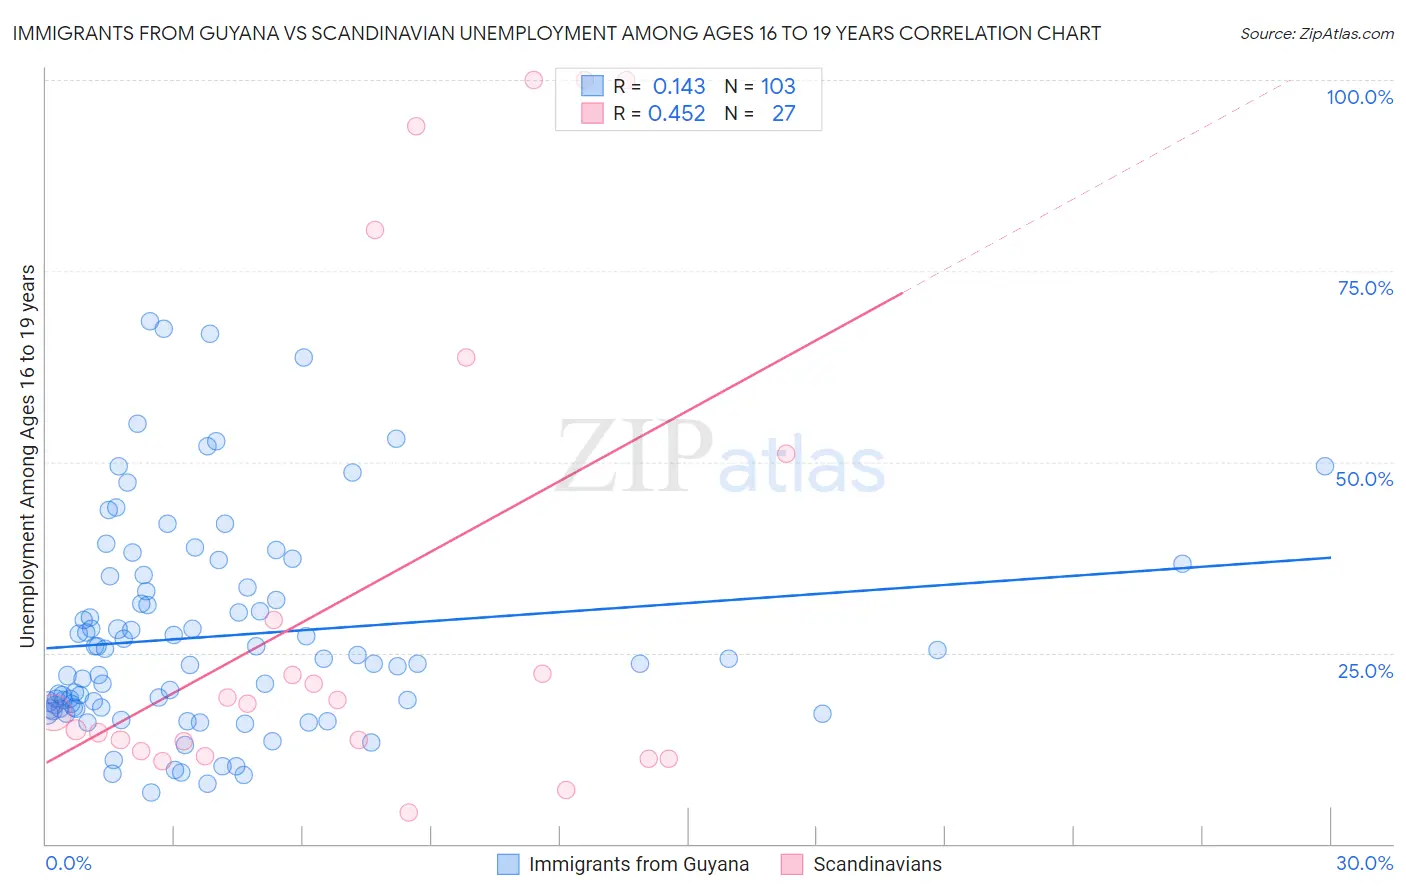
Immigrants from Guyana vs Scandinavian Unemployment Among Ages 16 to 19 years Correlation Chart
The statistical analysis conducted on geographies consisting of 178,672,884 people shows a poor positive correlation between the proportion of Immigrants from Guyana and unemployment rate among population between the ages 16 and 19 in the United States with a correlation coefficient (R) of 0.143 and weighted average of 25.5%. Similarly, the statistical analysis conducted on geographies consisting of 435,734,539 people shows a moderate positive correlation between the proportion of Scandinavians and unemployment rate among population between the ages 16 and 19 in the United States with a correlation coefficient (R) of 0.452 and weighted average of 15.4%, a difference of 65.2%.
Unemployment Among Ages 16 to 19 years Correlation Summary
| Measurement | Immigrants from Guyana | Scandinavian |
| Minimum | 6.7% | 4.1% |
| Maximum | 68.4% | 100.0% |
| Range | 61.7% | 95.9% |
| Mean | 27.2% | 33.1% |
| Median | 23.6% | 18.3% |
| Interquartile 25% (IQ1) | 17.7% | 12.1% |
| Interquartile 75% (IQ3) | 33.5% | 51.1% |
| Interquartile Range (IQR) | 15.8% | 39.0% |
| Standard Deviation (Sample) | 13.8% | 32.6% |
| Standard Deviation (Population) | 13.7% | 32.0% |
Similar Demographics by Unemployment Among Ages 16 to 19 years
Demographics Similar to Immigrants from Guyana by Unemployment Among Ages 16 to 19 years
In terms of unemployment among ages 16 to 19 years, the demographic groups most similar to Immigrants from Guyana are Immigrants from St. Vincent and the Grenadines (25.7%, a difference of 0.81%), Immigrants from Grenada (25.7%, a difference of 1.0%), Kiowa (25.2%, a difference of 1.1%), Arapaho (25.2%, a difference of 1.3%), and Guyanese (24.8%, a difference of 2.6%).
| Demographics | Rating | Rank | Unemployment Among Ages 16 to 19 years |
| Dominicans | 0.0 /100 | #330 | Tragic 23.6% |
| British West Indians | 0.0 /100 | #331 | Tragic 24.0% |
| Immigrants | Barbados | 0.0 /100 | #332 | Tragic 24.0% |
| Paiute | 0.0 /100 | #333 | Tragic 24.4% |
| Guyanese | 0.0 /100 | #334 | Tragic 24.8% |
| Arapaho | 0.0 /100 | #335 | Tragic 25.2% |
| Kiowa | 0.0 /100 | #336 | Tragic 25.2% |
| Immigrants | Guyana | 0.0 /100 | #337 | Tragic 25.5% |
| Immigrants | St. Vincent and the Grenadines | 0.0 /100 | #338 | Tragic 25.7% |
| Immigrants | Grenada | 0.0 /100 | #339 | Tragic 25.7% |
| Crow | 0.0 /100 | #340 | Tragic 26.2% |
| Puerto Ricans | 0.0 /100 | #341 | Tragic 27.5% |
| Inupiat | 0.0 /100 | #342 | Tragic 28.1% |
| Navajo | 0.0 /100 | #343 | Tragic 29.0% |
| Colville | 0.0 /100 | #344 | Tragic 29.7% |
Demographics Similar to Scandinavians by Unemployment Among Ages 16 to 19 years
In terms of unemployment among ages 16 to 19 years, the demographic groups most similar to Scandinavians are Zimbabwean (15.4%, a difference of 0.11%), Czech (15.4%, a difference of 0.33%), Indonesian (15.5%, a difference of 0.53%), Immigrants from Bosnia and Herzegovina (15.3%, a difference of 0.57%), and Taiwanese (15.5%, a difference of 0.63%).
| Demographics | Rating | Rank | Unemployment Among Ages 16 to 19 years |
| Immigrants | India | 100.0 /100 | #2 | Exceptional 15.0% |
| Luxembourgers | 100.0 /100 | #3 | Exceptional 15.1% |
| Danes | 100.0 /100 | #4 | Exceptional 15.2% |
| Immigrants | Somalia | 100.0 /100 | #5 | Exceptional 15.3% |
| Swedes | 100.0 /100 | #6 | Exceptional 15.3% |
| Immigrants | Bosnia and Herzegovina | 100.0 /100 | #7 | Exceptional 15.3% |
| Czechs | 100.0 /100 | #8 | Exceptional 15.4% |
| Scandinavians | 100.0 /100 | #9 | Exceptional 15.4% |
| Zimbabweans | 100.0 /100 | #10 | Exceptional 15.4% |
| Indonesians | 100.0 /100 | #11 | Exceptional 15.5% |
| Taiwanese | 100.0 /100 | #12 | Exceptional 15.5% |
| Immigrants | Burma/Myanmar | 100.0 /100 | #13 | Exceptional 15.6% |
| Immigrants | Zaire | 100.0 /100 | #14 | Exceptional 15.6% |
| Yugoslavians | 100.0 /100 | #15 | Exceptional 15.6% |
| Germans | 100.0 /100 | #16 | Exceptional 15.7% |