Immigrants from Guyana vs Danish 4 or more Vehicles in Household
COMPARE
Immigrants from Guyana
Danish
4 or more Vehicles in Household
4 or more Vehicles in Household Comparison
Immigrants from Guyana
Danes
3.4%
4 OR MORE VEHICLES IN HOUSEHOLD
0.0/ 100
METRIC RATING
344th/ 347
METRIC RANK
8.6%
4 OR MORE VEHICLES IN HOUSEHOLD
100.0/ 100
METRIC RATING
21st/ 347
METRIC RANK
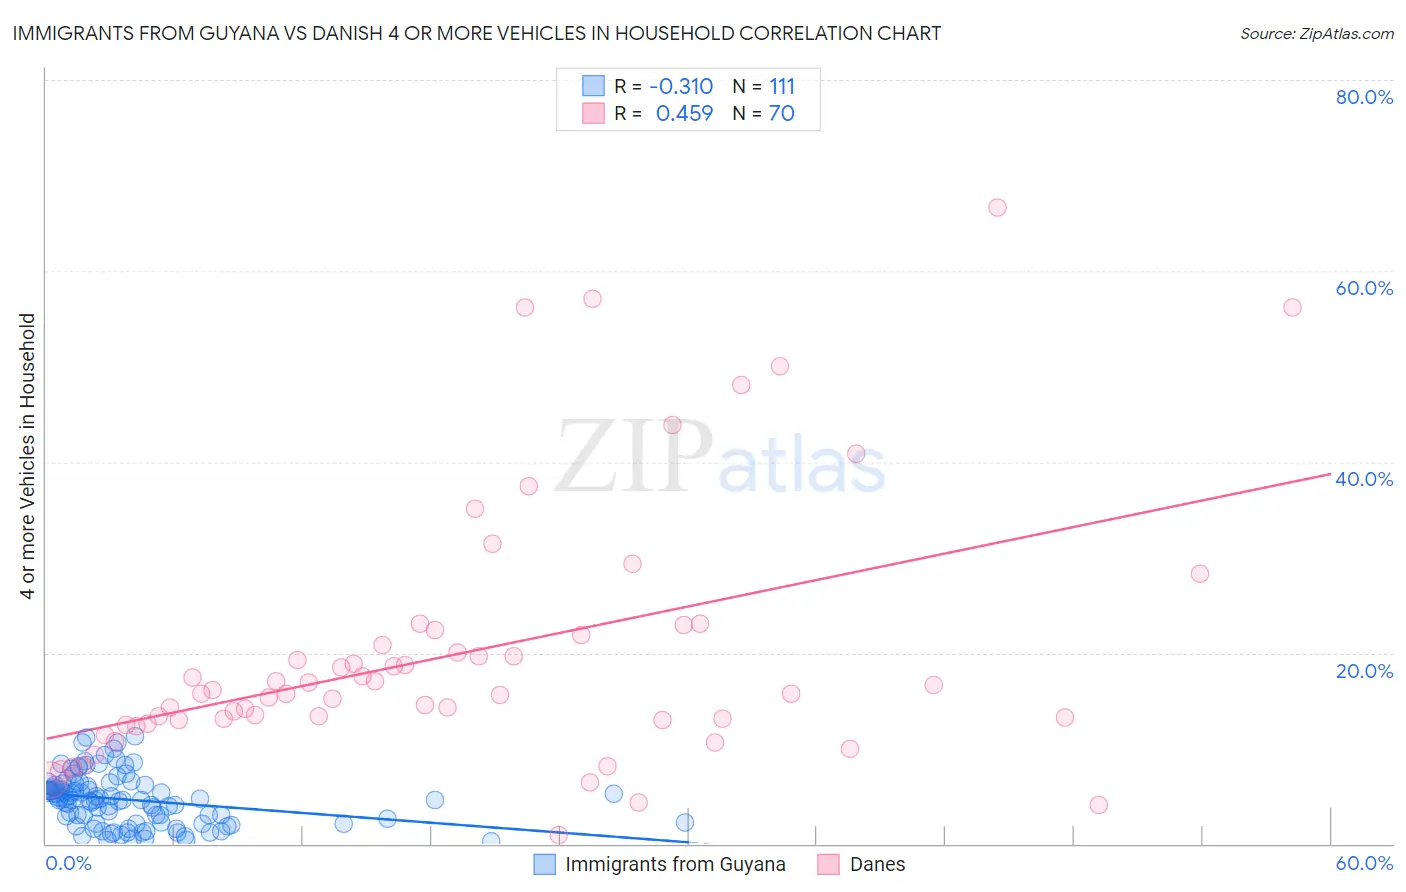
Immigrants from Guyana vs Danish 4 or more Vehicles in Household Correlation Chart
The statistical analysis conducted on geographies consisting of 182,580,983 people shows a mild negative correlation between the proportion of Immigrants from Guyana and percentage of households with 4 or more vehicles available in the United States with a correlation coefficient (R) of -0.310 and weighted average of 3.4%. Similarly, the statistical analysis conducted on geographies consisting of 472,183,254 people shows a moderate positive correlation between the proportion of Danes and percentage of households with 4 or more vehicles available in the United States with a correlation coefficient (R) of 0.459 and weighted average of 8.6%, a difference of 152.3%.
4 or more Vehicles in Household Correlation Summary
| Measurement | Immigrants from Guyana | Danish |
| Minimum | 0.29% | 0.95% |
| Maximum | 11.2% | 66.7% |
| Range | 10.9% | 65.7% |
| Mean | 4.6% | 20.0% |
| Median | 4.6% | 15.7% |
| Interquartile 25% (IQ1) | 2.2% | 12.9% |
| Interquartile 75% (IQ3) | 6.2% | 21.9% |
| Interquartile Range (IQR) | 4.0% | 9.0% |
| Standard Deviation (Sample) | 2.6% | 13.7% |
| Standard Deviation (Population) | 2.6% | 13.6% |
Similar Demographics by 4 or more Vehicles in Household
Demographics Similar to Immigrants from Guyana by 4 or more Vehicles in Household
In terms of 4 or more vehicles in household, the demographic groups most similar to Immigrants from Guyana are British West Indian (3.5%, a difference of 1.6%), Guyanese (3.5%, a difference of 2.6%), Dominican (3.5%, a difference of 3.3%), Immigrants from Dominican Republic (3.3%, a difference of 4.1%), and Immigrants from Barbados (3.6%, a difference of 6.1%).
| Demographics | Rating | Rank | 4 or more Vehicles in Household |
| Immigrants | Albania | 0.0 /100 | #333 | Tragic 4.1% |
| Immigrants | Trinidad and Tobago | 0.0 /100 | #334 | Tragic 4.1% |
| Barbadians | 0.0 /100 | #335 | Tragic 3.9% |
| Immigrants | Bangladesh | 0.0 /100 | #336 | Tragic 3.9% |
| Vietnamese | 0.0 /100 | #337 | Tragic 3.9% |
| Immigrants | Cabo Verde | 0.0 /100 | #338 | Tragic 3.8% |
| Immigrants | Uzbekistan | 0.0 /100 | #339 | Tragic 3.6% |
| Immigrants | Barbados | 0.0 /100 | #340 | Tragic 3.6% |
| Dominicans | 0.0 /100 | #341 | Tragic 3.5% |
| Guyanese | 0.0 /100 | #342 | Tragic 3.5% |
| British West Indians | 0.0 /100 | #343 | Tragic 3.5% |
| Immigrants | Guyana | 0.0 /100 | #344 | Tragic 3.4% |
| Immigrants | Dominican Republic | 0.0 /100 | #345 | Tragic 3.3% |
| Immigrants | St. Vincent and the Grenadines | 0.0 /100 | #346 | Tragic 3.0% |
| Immigrants | Grenada | 0.0 /100 | #347 | Tragic 2.7% |
Demographics Similar to Danes by 4 or more Vehicles in Household
In terms of 4 or more vehicles in household, the demographic groups most similar to Danes are Pueblo (8.6%, a difference of 0.050%), Immigrants from Vietnam (8.6%, a difference of 0.050%), Immigrants from Philippines (8.5%, a difference of 0.26%), Korean (8.6%, a difference of 0.87%), and Immigrants from Central America (8.5%, a difference of 1.1%).
| Demographics | Rating | Rank | 4 or more Vehicles in Household |
| Chinese | 100.0 /100 | #14 | Exceptional 8.8% |
| Shoshone | 100.0 /100 | #15 | Exceptional 8.8% |
| Lumbee | 100.0 /100 | #16 | Exceptional 8.8% |
| Ute | 100.0 /100 | #17 | Exceptional 8.8% |
| Nepalese | 100.0 /100 | #18 | Exceptional 8.7% |
| Koreans | 100.0 /100 | #19 | Exceptional 8.6% |
| Pueblo | 100.0 /100 | #20 | Exceptional 8.6% |
| Danes | 100.0 /100 | #21 | Exceptional 8.6% |
| Immigrants | Vietnam | 100.0 /100 | #22 | Exceptional 8.6% |
| Immigrants | Philippines | 100.0 /100 | #23 | Exceptional 8.5% |
| Immigrants | Central America | 100.0 /100 | #24 | Exceptional 8.5% |
| Basques | 100.0 /100 | #25 | Exceptional 8.4% |
| Mexican American Indians | 100.0 /100 | #26 | Exceptional 8.4% |
| Sri Lankans | 100.0 /100 | #27 | Exceptional 8.4% |
| Cheyenne | 100.0 /100 | #28 | Exceptional 8.3% |