Immigrants from Syria vs Native Hawaiian 1 or more Vehicles in Household
COMPARE
Immigrants from Syria
Native Hawaiian
1 or more Vehicles in Household
1 or more Vehicles in Household Comparison
Immigrants from Syria
Native Hawaiians
90.4%
1 OR MORE VEHICLES IN HOUSEHOLD
87.5/ 100
METRIC RATING
133rd/ 347
METRIC RANK
92.4%
1 OR MORE VEHICLES IN HOUSEHOLD
100.0/ 100
METRIC RATING
29th/ 347
METRIC RANK
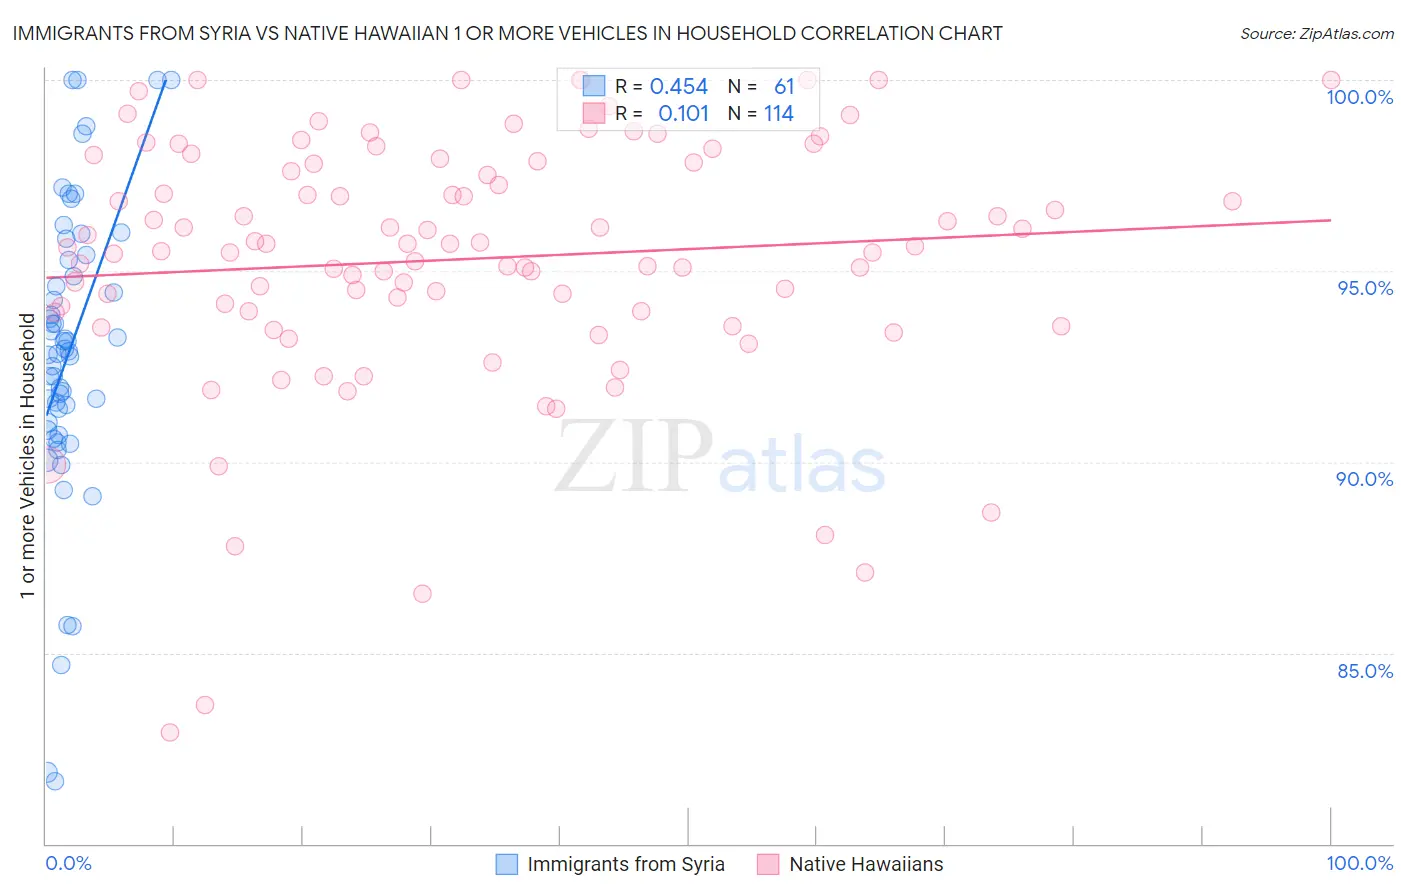
Immigrants from Syria vs Native Hawaiian 1 or more Vehicles in Household Correlation Chart
The statistical analysis conducted on geographies consisting of 174,034,006 people shows a moderate positive correlation between the proportion of Immigrants from Syria and percentage of households with 1 or more vehicles available in the United States with a correlation coefficient (R) of 0.454 and weighted average of 90.4%. Similarly, the statistical analysis conducted on geographies consisting of 331,859,591 people shows a poor positive correlation between the proportion of Native Hawaiians and percentage of households with 1 or more vehicles available in the United States with a correlation coefficient (R) of 0.101 and weighted average of 92.4%, a difference of 2.3%.
1 or more Vehicles in Household Correlation Summary
| Measurement | Immigrants from Syria | Native Hawaiian |
| Minimum | 81.7% | 82.9% |
| Maximum | 100.0% | 100.0% |
| Range | 18.3% | 17.1% |
| Mean | 92.9% | 95.3% |
| Median | 92.9% | 95.6% |
| Interquartile 25% (IQ1) | 90.9% | 93.9% |
| Interquartile 75% (IQ3) | 95.3% | 97.8% |
| Interquartile Range (IQR) | 4.4% | 3.9% |
| Standard Deviation (Sample) | 3.9% | 3.3% |
| Standard Deviation (Population) | 3.9% | 3.3% |
Similar Demographics by 1 or more Vehicles in Household
Demographics Similar to Immigrants from Syria by 1 or more Vehicles in Household
In terms of 1 or more vehicles in household, the demographic groups most similar to Immigrants from Syria are Immigrants from South Africa (90.4%, a difference of 0.020%), Kenyan (90.4%, a difference of 0.020%), Immigrants from Oceania (90.4%, a difference of 0.020%), Immigrants from Kenya (90.4%, a difference of 0.040%), and Hungarian (90.3%, a difference of 0.040%).
| Demographics | Rating | Rank | 1 or more Vehicles in Household |
| Immigrants | Cameroon | 89.4 /100 | #126 | Excellent 90.4% |
| Immigrants | Azores | 89.1 /100 | #127 | Excellent 90.4% |
| Burmese | 89.0 /100 | #128 | Excellent 90.4% |
| Marshallese | 88.9 /100 | #129 | Excellent 90.4% |
| Nicaraguans | 88.8 /100 | #130 | Excellent 90.4% |
| Immigrants | Kenya | 88.5 /100 | #131 | Excellent 90.4% |
| Immigrants | South Africa | 88.1 /100 | #132 | Excellent 90.4% |
| Immigrants | Syria | 87.5 /100 | #133 | Excellent 90.4% |
| Kenyans | 87.0 /100 | #134 | Excellent 90.4% |
| Immigrants | Oceania | 86.9 /100 | #135 | Excellent 90.4% |
| Hungarians | 86.5 /100 | #136 | Excellent 90.3% |
| Latvians | 86.3 /100 | #137 | Excellent 90.3% |
| Syrians | 86.3 /100 | #138 | Excellent 90.3% |
| Estonians | 85.6 /100 | #139 | Excellent 90.3% |
| Sudanese | 85.2 /100 | #140 | Excellent 90.3% |
Demographics Similar to Native Hawaiians by 1 or more Vehicles in Household
In terms of 1 or more vehicles in household, the demographic groups most similar to Native Hawaiians are Finnish (92.4%, a difference of 0.0%), Sri Lankan (92.5%, a difference of 0.010%), Samoan (92.4%, a difference of 0.010%), American (92.5%, a difference of 0.050%), and Basque (92.4%, a difference of 0.050%).
| Demographics | Rating | Rank | 1 or more Vehicles in Household |
| French | 100.0 /100 | #22 | Exceptional 92.7% |
| Nepalese | 100.0 /100 | #23 | Exceptional 92.6% |
| Yaqui | 100.0 /100 | #24 | Exceptional 92.6% |
| Immigrants | Iraq | 100.0 /100 | #25 | Exceptional 92.5% |
| British | 100.0 /100 | #26 | Exceptional 92.5% |
| Americans | 100.0 /100 | #27 | Exceptional 92.5% |
| Sri Lankans | 100.0 /100 | #28 | Exceptional 92.5% |
| Native Hawaiians | 100.0 /100 | #29 | Exceptional 92.4% |
| Finns | 100.0 /100 | #30 | Exceptional 92.4% |
| Samoans | 100.0 /100 | #31 | Exceptional 92.4% |
| Basques | 100.0 /100 | #32 | Exceptional 92.4% |
| Cherokee | 100.0 /100 | #33 | Exceptional 92.4% |
| Italians | 99.9 /100 | #34 | Exceptional 92.3% |
| Czechoslovakians | 99.9 /100 | #35 | Exceptional 92.3% |
| Malaysians | 99.9 /100 | #36 | Exceptional 92.3% |