Immigrants from Greece vs Native Hawaiian Unemployment Among Women with Children Under 6 years
COMPARE
Immigrants from Greece
Native Hawaiian
Unemployment Among Women with Children Under 6 years
Unemployment Among Women with Children Under 6 years Comparison
Immigrants from Greece
Native Hawaiians
7.1%
UNEMPLOYMENT AMONG WOMEN WITH CHILDREN UNDER 6 YEARS
98.9/ 100
METRIC RATING
80th/ 347
METRIC RANK
8.2%
UNEMPLOYMENT AMONG WOMEN WITH CHILDREN UNDER 6 YEARS
1.7/ 100
METRIC RATING
245th/ 347
METRIC RANK
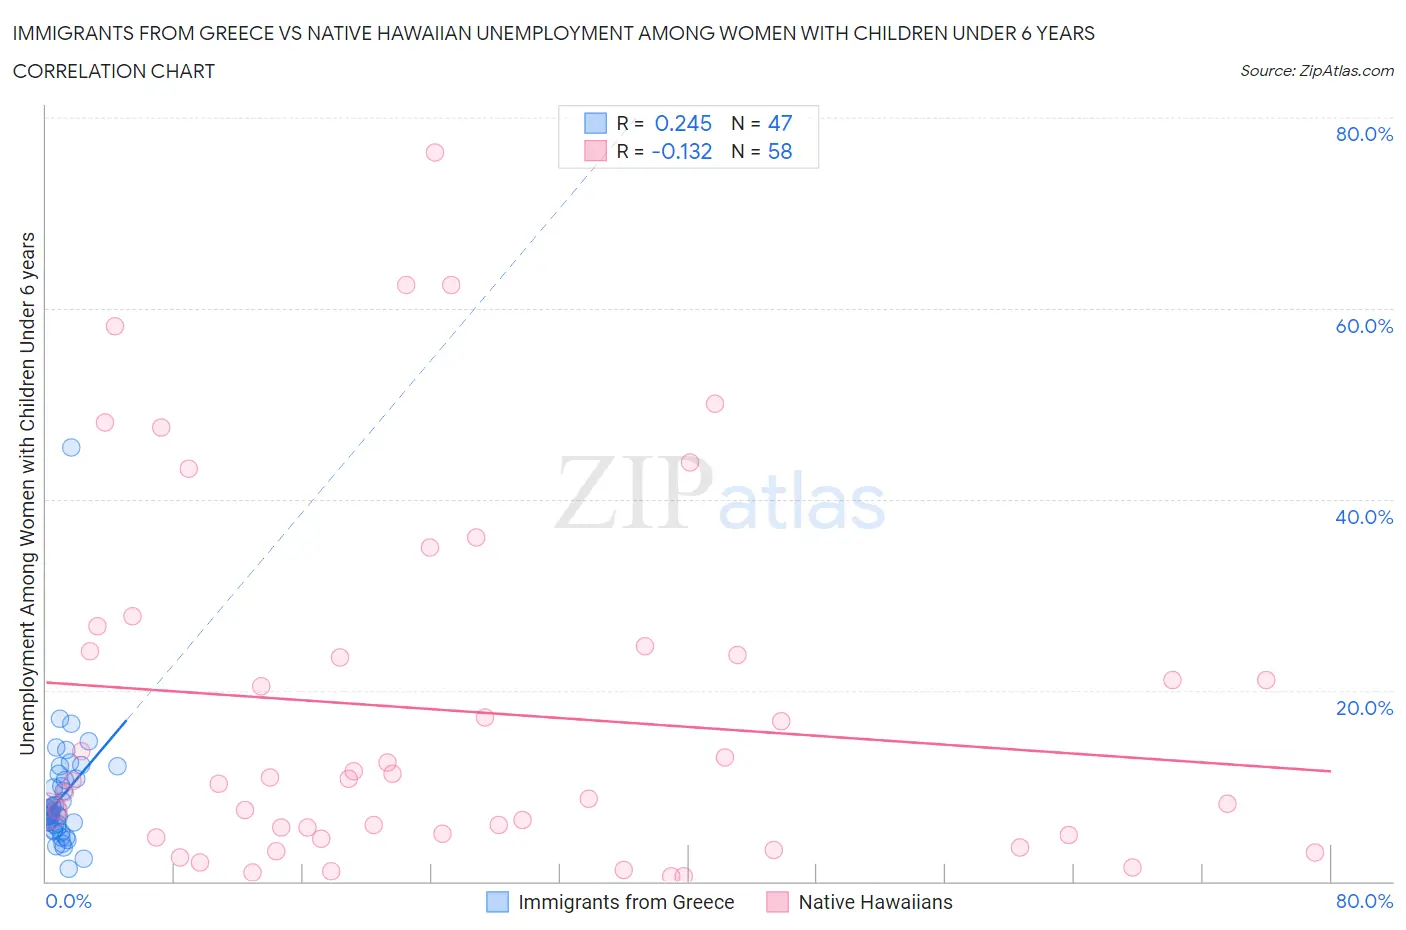
Immigrants from Greece vs Native Hawaiian Unemployment Among Women with Children Under 6 years Correlation Chart
The statistical analysis conducted on geographies consisting of 175,834,833 people shows a weak positive correlation between the proportion of Immigrants from Greece and unemployment rate among women with children under the age of 6 in the United States with a correlation coefficient (R) of 0.245 and weighted average of 7.1%. Similarly, the statistical analysis conducted on geographies consisting of 264,079,731 people shows a poor negative correlation between the proportion of Native Hawaiians and unemployment rate among women with children under the age of 6 in the United States with a correlation coefficient (R) of -0.132 and weighted average of 8.2%, a difference of 15.2%.
Unemployment Among Women with Children Under 6 years Correlation Summary
| Measurement | Immigrants from Greece | Native Hawaiian |
| Minimum | 1.3% | 0.50% |
| Maximum | 45.4% | 76.4% |
| Range | 44.1% | 75.9% |
| Mean | 8.8% | 17.8% |
| Median | 7.3% | 10.6% |
| Interquartile 25% (IQ1) | 5.6% | 4.8% |
| Interquartile 75% (IQ3) | 10.7% | 24.1% |
| Interquartile Range (IQR) | 5.1% | 19.3% |
| Standard Deviation (Sample) | 6.5% | 18.5% |
| Standard Deviation (Population) | 6.5% | 18.4% |
Similar Demographics by Unemployment Among Women with Children Under 6 years
Demographics Similar to Immigrants from Greece by Unemployment Among Women with Children Under 6 years
In terms of unemployment among women with children under 6 years, the demographic groups most similar to Immigrants from Greece are Immigrants from Fiji (7.1%, a difference of 0.020%), Immigrants from Venezuela (7.1%, a difference of 0.040%), Immigrants from Somalia (7.1%, a difference of 0.070%), Immigrants from Croatia (7.1%, a difference of 0.11%), and Estonian (7.1%, a difference of 0.15%).
| Demographics | Rating | Rank | Unemployment Among Women with Children Under 6 years |
| Immigrants | Czechoslovakia | 99.2 /100 | #73 | Exceptional 7.0% |
| Turks | 99.2 /100 | #74 | Exceptional 7.0% |
| Immigrants | Eastern Europe | 99.0 /100 | #75 | Exceptional 7.1% |
| Estonians | 99.0 /100 | #76 | Exceptional 7.1% |
| Immigrants | Croatia | 98.9 /100 | #77 | Exceptional 7.1% |
| Immigrants | Somalia | 98.9 /100 | #78 | Exceptional 7.1% |
| Immigrants | Fiji | 98.9 /100 | #79 | Exceptional 7.1% |
| Immigrants | Greece | 98.9 /100 | #80 | Exceptional 7.1% |
| Immigrants | Venezuela | 98.8 /100 | #81 | Exceptional 7.1% |
| Immigrants | Afghanistan | 98.7 /100 | #82 | Exceptional 7.1% |
| Egyptians | 98.7 /100 | #83 | Exceptional 7.1% |
| Immigrants | Albania | 98.7 /100 | #84 | Exceptional 7.1% |
| Immigrants | Romania | 98.7 /100 | #85 | Exceptional 7.1% |
| Immigrants | Zimbabwe | 98.6 /100 | #86 | Exceptional 7.1% |
| Alsatians | 98.4 /100 | #87 | Exceptional 7.1% |
Demographics Similar to Native Hawaiians by Unemployment Among Women with Children Under 6 years
In terms of unemployment among women with children under 6 years, the demographic groups most similar to Native Hawaiians are French (8.2%, a difference of 0.010%), Hawaiian (8.2%, a difference of 0.040%), Central American (8.2%, a difference of 0.33%), Dutch (8.1%, a difference of 0.59%), and German Russian (8.2%, a difference of 0.61%).
| Demographics | Rating | Rank | Unemployment Among Women with Children Under 6 years |
| Immigrants | Middle Africa | 3.2 /100 | #238 | Tragic 8.1% |
| Irish | 2.7 /100 | #239 | Tragic 8.1% |
| Immigrants | El Salvador | 2.6 /100 | #240 | Tragic 8.1% |
| Liberians | 2.6 /100 | #241 | Tragic 8.1% |
| Dutch | 2.5 /100 | #242 | Tragic 8.1% |
| Hawaiians | 1.8 /100 | #243 | Tragic 8.2% |
| French | 1.7 /100 | #244 | Tragic 8.2% |
| Native Hawaiians | 1.7 /100 | #245 | Tragic 8.2% |
| Central Americans | 1.4 /100 | #246 | Tragic 8.2% |
| German Russians | 1.2 /100 | #247 | Tragic 8.2% |
| Immigrants | Western Africa | 1.1 /100 | #248 | Tragic 8.2% |
| Immigrants | Sierra Leone | 1.1 /100 | #249 | Tragic 8.2% |
| Nigerians | 1.1 /100 | #250 | Tragic 8.2% |
| Guyanese | 1.0 /100 | #251 | Tragic 8.2% |
| Ghanaians | 1.0 /100 | #252 | Tragic 8.2% |