Cape Verdean vs Afghan 1 or more Vehicles in Household
COMPARE
Cape Verdean
Afghan
1 or more Vehicles in Household
1 or more Vehicles in Household Comparison
Cape Verdeans
Afghans
84.5%
1 OR MORE VEHICLES IN HOUSEHOLD
0.0/ 100
METRIC RATING
312th/ 347
METRIC RANK
92.1%
1 OR MORE VEHICLES IN HOUSEHOLD
99.9/ 100
METRIC RATING
49th/ 347
METRIC RANK
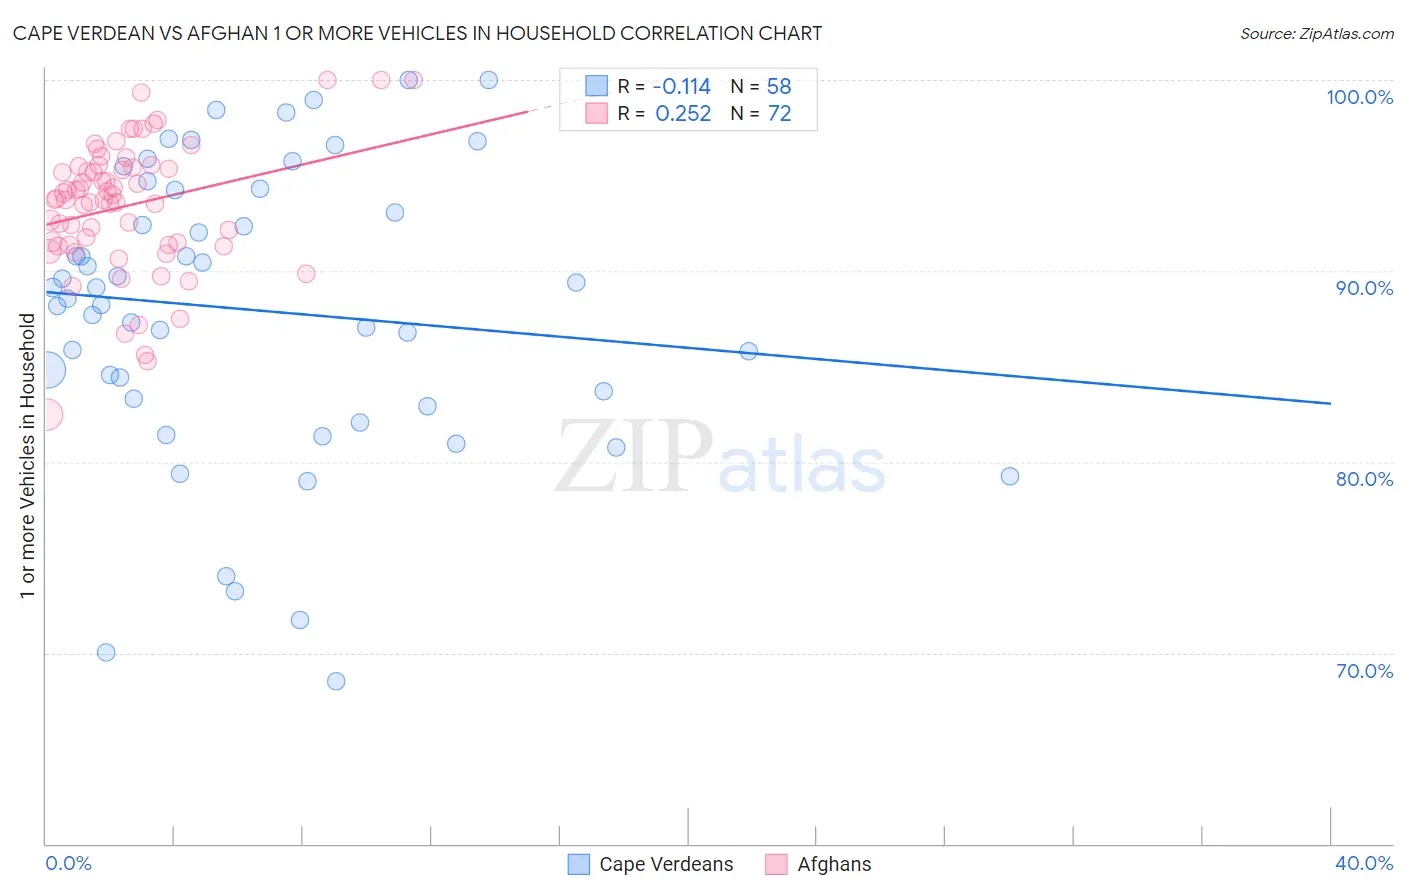
Cape Verdean vs Afghan 1 or more Vehicles in Household Correlation Chart
The statistical analysis conducted on geographies consisting of 107,533,487 people shows a poor negative correlation between the proportion of Cape Verdeans and percentage of households with 1 or more vehicles available in the United States with a correlation coefficient (R) of -0.114 and weighted average of 84.5%. Similarly, the statistical analysis conducted on geographies consisting of 148,819,650 people shows a weak positive correlation between the proportion of Afghans and percentage of households with 1 or more vehicles available in the United States with a correlation coefficient (R) of 0.252 and weighted average of 92.1%, a difference of 9.0%.
1 or more Vehicles in Household Correlation Summary
| Measurement | Cape Verdean | Afghan |
| Minimum | 68.5% | 82.5% |
| Maximum | 100.0% | 100.0% |
| Range | 31.5% | 17.5% |
| Mean | 87.9% | 93.4% |
| Median | 88.8% | 93.8% |
| Interquartile 25% (IQ1) | 83.3% | 91.3% |
| Interquartile 75% (IQ3) | 94.3% | 95.4% |
| Interquartile Range (IQR) | 10.9% | 4.1% |
| Standard Deviation (Sample) | 7.6% | 3.5% |
| Standard Deviation (Population) | 7.6% | 3.4% |
Similar Demographics by 1 or more Vehicles in Household
Demographics Similar to Cape Verdeans by 1 or more Vehicles in Household
In terms of 1 or more vehicles in household, the demographic groups most similar to Cape Verdeans are Immigrants from Israel (84.5%, a difference of 0.020%), Albanian (84.4%, a difference of 0.090%), Puerto Rican (84.6%, a difference of 0.11%), U.S. Virgin Islander (84.6%, a difference of 0.15%), and Cypriot (84.4%, a difference of 0.16%).
| Demographics | Rating | Rank | 1 or more Vehicles in Household |
| Immigrants | China | 0.0 /100 | #305 | Tragic 84.9% |
| Immigrants | Western Africa | 0.0 /100 | #306 | Tragic 84.9% |
| Tohono O'odham | 0.0 /100 | #307 | Tragic 84.7% |
| Immigrants | Belize | 0.0 /100 | #308 | Tragic 84.7% |
| Immigrants | Haiti | 0.0 /100 | #309 | Tragic 84.7% |
| U.S. Virgin Islanders | 0.0 /100 | #310 | Tragic 84.6% |
| Puerto Ricans | 0.0 /100 | #311 | Tragic 84.6% |
| Cape Verdeans | 0.0 /100 | #312 | Tragic 84.5% |
| Immigrants | Israel | 0.0 /100 | #313 | Tragic 84.5% |
| Albanians | 0.0 /100 | #314 | Tragic 84.4% |
| Cypriots | 0.0 /100 | #315 | Tragic 84.4% |
| Alaska Natives | 0.0 /100 | #316 | Tragic 83.8% |
| Ghanaians | 0.0 /100 | #317 | Tragic 83.6% |
| Immigrants | Ghana | 0.0 /100 | #318 | Tragic 83.4% |
| Immigrants | Belarus | 0.0 /100 | #319 | Tragic 83.3% |
Demographics Similar to Afghans by 1 or more Vehicles in Household
In terms of 1 or more vehicles in household, the demographic groups most similar to Afghans are Belgian (92.1%, a difference of 0.010%), Guamanian/Chamorro (92.1%, a difference of 0.010%), Celtic (92.1%, a difference of 0.020%), Korean (92.1%, a difference of 0.050%), and Hawaiian (92.0%, a difference of 0.080%).
| Demographics | Rating | Rank | 1 or more Vehicles in Household |
| Chickasaw | 99.9 /100 | #42 | Exceptional 92.3% |
| Spanish | 99.9 /100 | #43 | Exceptional 92.3% |
| Choctaw | 99.9 /100 | #44 | Exceptional 92.2% |
| Immigrants | Nonimmigrants | 99.9 /100 | #45 | Exceptional 92.2% |
| Immigrants | Fiji | 99.9 /100 | #46 | Exceptional 92.2% |
| Northern Europeans | 99.9 /100 | #47 | Exceptional 92.2% |
| Belgians | 99.9 /100 | #48 | Exceptional 92.1% |
| Afghans | 99.9 /100 | #49 | Exceptional 92.1% |
| Guamanians/Chamorros | 99.9 /100 | #50 | Exceptional 92.1% |
| Celtics | 99.9 /100 | #51 | Exceptional 92.1% |
| Koreans | 99.9 /100 | #52 | Exceptional 92.1% |
| Hawaiians | 99.9 /100 | #53 | Exceptional 92.0% |
| Slovenes | 99.9 /100 | #54 | Exceptional 92.0% |
| Immigrants | Afghanistan | 99.9 /100 | #55 | Exceptional 92.0% |
| Immigrants | Venezuela | 99.9 /100 | #56 | Exceptional 92.0% |