Immigrants from Ghana vs Bahamian 2 or more Vehicles in Household
COMPARE
Immigrants from Ghana
Bahamian
2 or more Vehicles in Household
2 or more Vehicles in Household Comparison
Immigrants from Ghana
Bahamians
47.4%
2 OR MORE VEHICLES IN HOUSEHOLD
0.0/ 100
METRIC RATING
314th/ 347
METRIC RANK
51.5%
2 OR MORE VEHICLES IN HOUSEHOLD
0.1/ 100
METRIC RATING
282nd/ 347
METRIC RANK
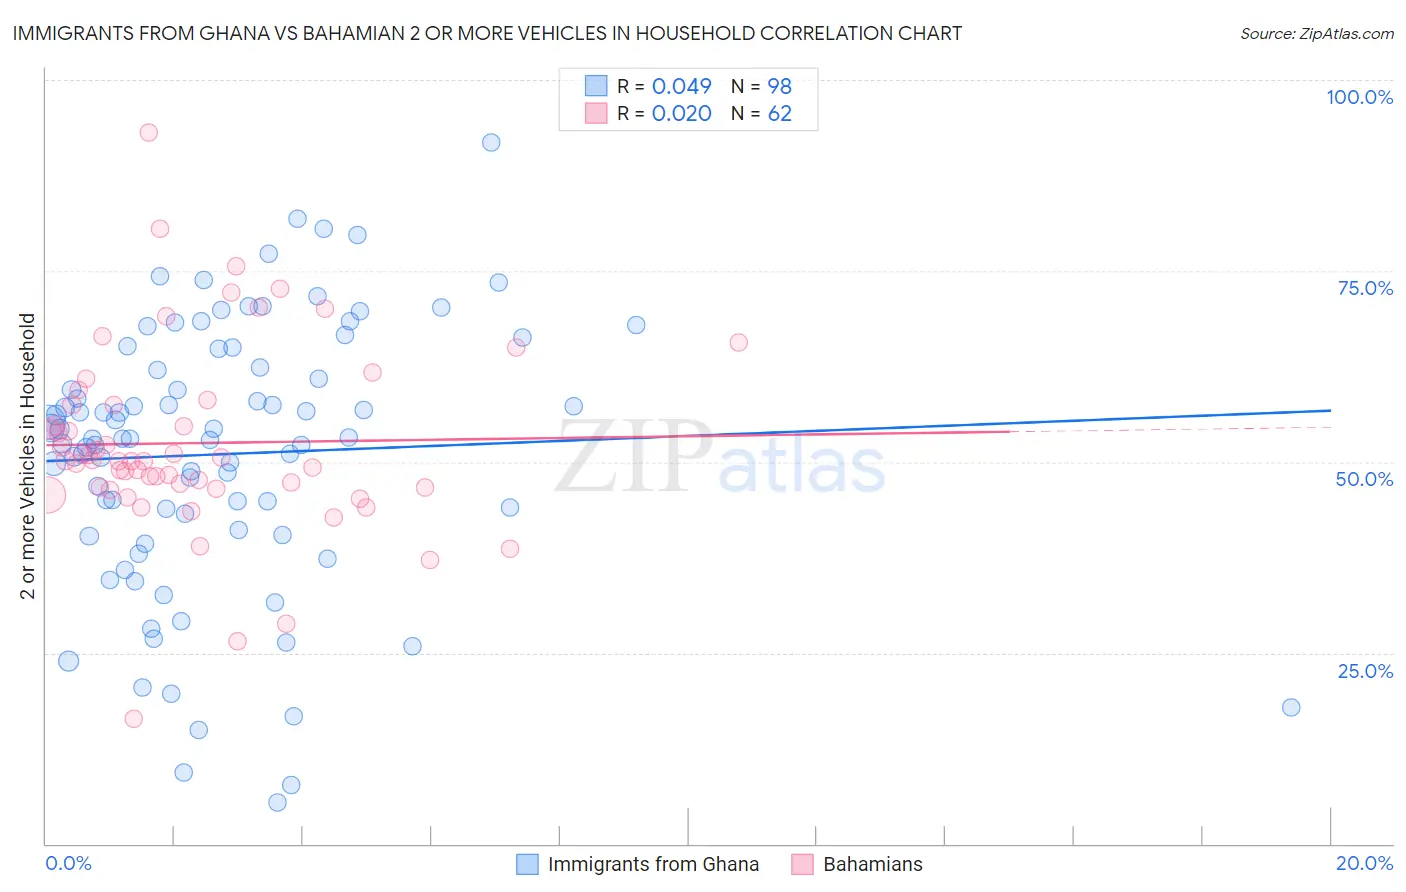
Immigrants from Ghana vs Bahamian 2 or more Vehicles in Household Correlation Chart
The statistical analysis conducted on geographies consisting of 199,813,535 people shows no correlation between the proportion of Immigrants from Ghana and percentage of households with 2 or more vehicles available in the United States with a correlation coefficient (R) of 0.049 and weighted average of 47.4%. Similarly, the statistical analysis conducted on geographies consisting of 112,649,221 people shows no correlation between the proportion of Bahamians and percentage of households with 2 or more vehicles available in the United States with a correlation coefficient (R) of 0.020 and weighted average of 51.5%, a difference of 8.8%.
2 or more Vehicles in Household Correlation Summary
| Measurement | Immigrants from Ghana | Bahamian |
| Minimum | 5.4% | 16.4% |
| Maximum | 91.9% | 93.2% |
| Range | 86.4% | 76.8% |
| Mean | 51.0% | 52.5% |
| Median | 53.0% | 50.1% |
| Interquartile 25% (IQ1) | 41.0% | 46.7% |
| Interquartile 75% (IQ3) | 62.3% | 57.5% |
| Interquartile Range (IQR) | 21.3% | 10.8% |
| Standard Deviation (Sample) | 17.5% | 12.5% |
| Standard Deviation (Population) | 17.5% | 12.4% |
Similar Demographics by 2 or more Vehicles in Household
Demographics Similar to Immigrants from Ghana by 2 or more Vehicles in Household
In terms of 2 or more vehicles in household, the demographic groups most similar to Immigrants from Ghana are U.S. Virgin Islander (47.5%, a difference of 0.22%), Haitian (47.6%, a difference of 0.40%), Puerto Rican (47.1%, a difference of 0.57%), Immigrants from Belarus (47.9%, a difference of 1.1%), and Ghanaian (48.0%, a difference of 1.3%).
| Demographics | Rating | Rank | 2 or more Vehicles in Household |
| Hopi | 0.0 /100 | #307 | Tragic 49.0% |
| Albanians | 0.0 /100 | #308 | Tragic 49.0% |
| Moroccans | 0.0 /100 | #309 | Tragic 48.8% |
| Ghanaians | 0.0 /100 | #310 | Tragic 48.0% |
| Immigrants | Belarus | 0.0 /100 | #311 | Tragic 47.9% |
| Haitians | 0.0 /100 | #312 | Tragic 47.6% |
| U.S. Virgin Islanders | 0.0 /100 | #313 | Tragic 47.5% |
| Immigrants | Ghana | 0.0 /100 | #314 | Tragic 47.4% |
| Puerto Ricans | 0.0 /100 | #315 | Tragic 47.1% |
| Cape Verdeans | 0.0 /100 | #316 | Tragic 46.8% |
| Immigrants | Haiti | 0.0 /100 | #317 | Tragic 46.5% |
| Immigrants | Albania | 0.0 /100 | #318 | Tragic 46.0% |
| Jamaicans | 0.0 /100 | #319 | Tragic 45.8% |
| Soviet Union | 0.0 /100 | #320 | Tragic 45.7% |
| Immigrants | Jamaica | 0.0 /100 | #321 | Tragic 44.5% |
Demographics Similar to Bahamians by 2 or more Vehicles in Household
In terms of 2 or more vehicles in household, the demographic groups most similar to Bahamians are Immigrants from Kazakhstan (51.6%, a difference of 0.060%), Immigrants from China (51.5%, a difference of 0.080%), Immigrants from Zaire (51.5%, a difference of 0.12%), Immigrants from Uruguay (51.4%, a difference of 0.28%), and Immigrants from Eastern Europe (51.7%, a difference of 0.37%).
| Demographics | Rating | Rank | 2 or more Vehicles in Household |
| Immigrants | Honduras | 0.2 /100 | #275 | Tragic 51.8% |
| Immigrants | Croatia | 0.2 /100 | #276 | Tragic 51.8% |
| Immigrants | Africa | 0.2 /100 | #277 | Tragic 51.8% |
| Yuman | 0.1 /100 | #278 | Tragic 51.7% |
| Liberians | 0.1 /100 | #279 | Tragic 51.7% |
| Immigrants | Eastern Europe | 0.1 /100 | #280 | Tragic 51.7% |
| Immigrants | Kazakhstan | 0.1 /100 | #281 | Tragic 51.6% |
| Bahamians | 0.1 /100 | #282 | Tragic 51.5% |
| Immigrants | China | 0.1 /100 | #283 | Tragic 51.5% |
| Immigrants | Zaire | 0.1 /100 | #284 | Tragic 51.5% |
| Immigrants | Uruguay | 0.1 /100 | #285 | Tragic 51.4% |
| Immigrants | Liberia | 0.1 /100 | #286 | Tragic 51.3% |
| Immigrants | Serbia | 0.1 /100 | #287 | Tragic 51.3% |
| Okinawans | 0.1 /100 | #288 | Tragic 51.2% |
| Somalis | 0.0 /100 | #289 | Tragic 51.1% |