Immigrants from Europe vs Bahamian Single Father Poverty
COMPARE
Immigrants from Europe
Bahamian
Single Father Poverty
Single Father Poverty Comparison
Immigrants from Europe
Bahamians
16.3%
SINGLE FATHER POVERTY
54.8/ 100
METRIC RATING
166th/ 347
METRIC RANK
18.0%
SINGLE FATHER POVERTY
0.0/ 100
METRIC RATING
288th/ 347
METRIC RANK
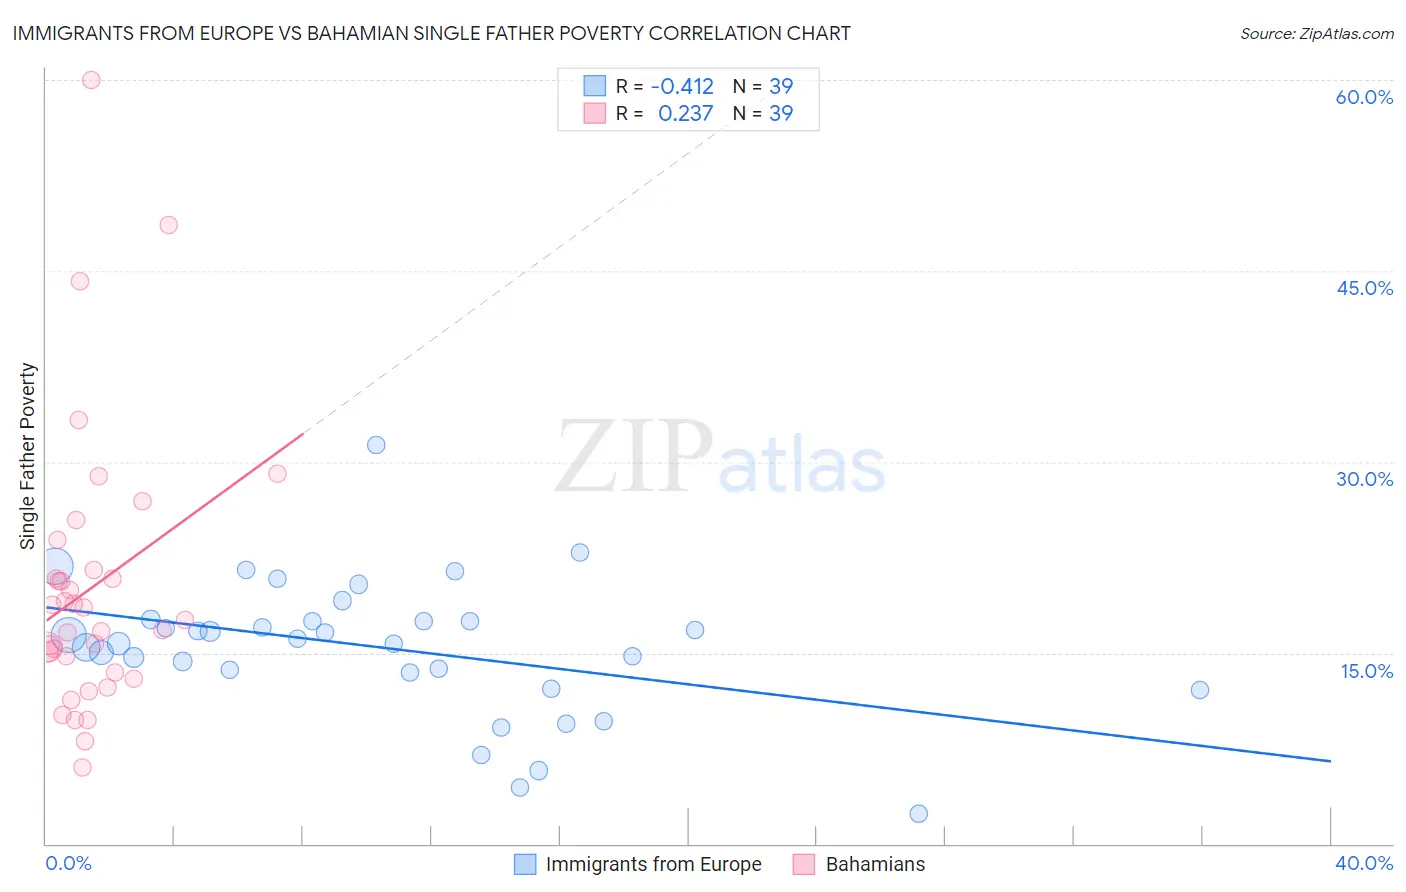
Immigrants from Europe vs Bahamian Single Father Poverty Correlation Chart
The statistical analysis conducted on geographies consisting of 399,898,147 people shows a moderate negative correlation between the proportion of Immigrants from Europe and poverty level among single fathers in the United States with a correlation coefficient (R) of -0.412 and weighted average of 16.3%. Similarly, the statistical analysis conducted on geographies consisting of 102,772,098 people shows a weak positive correlation between the proportion of Bahamians and poverty level among single fathers in the United States with a correlation coefficient (R) of 0.237 and weighted average of 18.0%, a difference of 10.5%.
Single Father Poverty Correlation Summary
| Measurement | Immigrants from Europe | Bahamian |
| Minimum | 2.4% | 6.0% |
| Maximum | 31.4% | 60.0% |
| Range | 29.0% | 54.0% |
| Mean | 15.4% | 20.1% |
| Median | 16.1% | 17.6% |
| Interquartile 25% (IQ1) | 13.5% | 13.4% |
| Interquartile 75% (IQ3) | 17.5% | 21.5% |
| Interquartile Range (IQR) | 4.0% | 8.0% |
| Standard Deviation (Sample) | 5.4% | 10.9% |
| Standard Deviation (Population) | 5.4% | 10.8% |
Similar Demographics by Single Father Poverty
Demographics Similar to Immigrants from Europe by Single Father Poverty
In terms of single father poverty, the demographic groups most similar to Immigrants from Europe are Guyanese (16.3%, a difference of 0.010%), Immigrants from Bangladesh (16.3%, a difference of 0.010%), Immigrants from Costa Rica (16.3%, a difference of 0.040%), Yugoslavian (16.3%, a difference of 0.040%), and Ugandan (16.3%, a difference of 0.050%).
| Demographics | Rating | Rank | Single Father Poverty |
| Belizeans | 59.9 /100 | #159 | Average 16.2% |
| Immigrants | Sudan | 59.8 /100 | #160 | Average 16.2% |
| Estonians | 56.7 /100 | #161 | Average 16.2% |
| Ugandans | 55.9 /100 | #162 | Average 16.3% |
| Immigrants | Costa Rica | 55.7 /100 | #163 | Average 16.3% |
| Guyanese | 55.2 /100 | #164 | Average 16.3% |
| Immigrants | Bangladesh | 55.1 /100 | #165 | Average 16.3% |
| Immigrants | Europe | 54.8 /100 | #166 | Average 16.3% |
| Yugoslavians | 53.9 /100 | #167 | Average 16.3% |
| Costa Ricans | 53.6 /100 | #168 | Average 16.3% |
| Northern Europeans | 52.8 /100 | #169 | Average 16.3% |
| Scandinavians | 52.3 /100 | #170 | Average 16.3% |
| Immigrants | Morocco | 50.7 /100 | #171 | Average 16.3% |
| Immigrants | Sierra Leone | 50.1 /100 | #172 | Average 16.3% |
| Immigrants | St. Vincent and the Grenadines | 50.0 /100 | #173 | Average 16.3% |
Demographics Similar to Bahamians by Single Father Poverty
In terms of single father poverty, the demographic groups most similar to Bahamians are Carpatho Rusyn (18.0%, a difference of 0.020%), Immigrants from North Macedonia (17.9%, a difference of 0.25%), Immigrants from Lebanon (17.9%, a difference of 0.42%), Irish (18.0%, a difference of 0.44%), and West Indian (18.0%, a difference of 0.47%).
| Demographics | Rating | Rank | Single Father Poverty |
| English | 0.0 /100 | #281 | Tragic 17.8% |
| Dutch | 0.0 /100 | #282 | Tragic 17.8% |
| Alsatians | 0.0 /100 | #283 | Tragic 17.8% |
| Welsh | 0.0 /100 | #284 | Tragic 17.8% |
| Immigrants | Lebanon | 0.0 /100 | #285 | Tragic 17.9% |
| Immigrants | North Macedonia | 0.0 /100 | #286 | Tragic 17.9% |
| Carpatho Rusyns | 0.0 /100 | #287 | Tragic 18.0% |
| Bahamians | 0.0 /100 | #288 | Tragic 18.0% |
| Irish | 0.0 /100 | #289 | Tragic 18.0% |
| West Indians | 0.0 /100 | #290 | Tragic 18.0% |
| Alaskan Athabascans | 0.0 /100 | #291 | Tragic 18.1% |
| Immigrants | Bahamas | 0.0 /100 | #292 | Tragic 18.1% |
| Alaska Natives | 0.0 /100 | #293 | Tragic 18.1% |
| U.S. Virgin Islanders | 0.0 /100 | #294 | Tragic 18.1% |
| Yakama | 0.0 /100 | #295 | Tragic 18.1% |