Salvadoran vs Bahamian 2 or more Vehicles in Household
COMPARE
Salvadoran
Bahamian
2 or more Vehicles in Household
2 or more Vehicles in Household Comparison
Salvadorans
Bahamians
56.3%
2 OR MORE VEHICLES IN HOUSEHOLD
84.7/ 100
METRIC RATING
138th/ 347
METRIC RANK
51.5%
2 OR MORE VEHICLES IN HOUSEHOLD
0.1/ 100
METRIC RATING
282nd/ 347
METRIC RANK
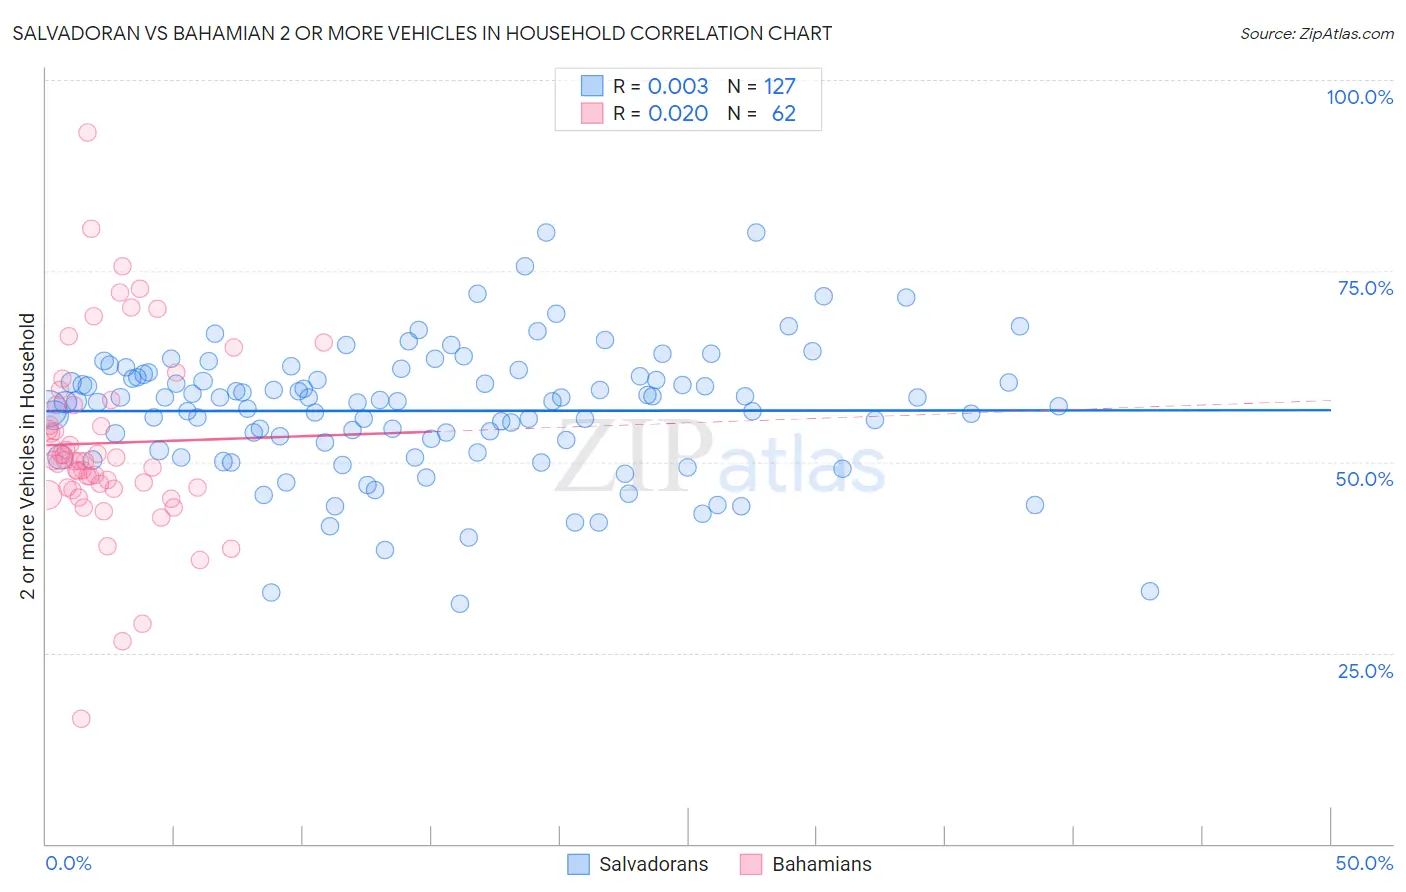
Salvadoran vs Bahamian 2 or more Vehicles in Household Correlation Chart
The statistical analysis conducted on geographies consisting of 398,636,512 people shows no correlation between the proportion of Salvadorans and percentage of households with 2 or more vehicles available in the United States with a correlation coefficient (R) of 0.003 and weighted average of 56.3%. Similarly, the statistical analysis conducted on geographies consisting of 112,649,221 people shows no correlation between the proportion of Bahamians and percentage of households with 2 or more vehicles available in the United States with a correlation coefficient (R) of 0.020 and weighted average of 51.5%, a difference of 9.2%.
2 or more Vehicles in Household Correlation Summary
| Measurement | Salvadoran | Bahamian |
| Minimum | 31.5% | 16.4% |
| Maximum | 80.1% | 93.2% |
| Range | 48.6% | 76.8% |
| Mean | 56.7% | 52.5% |
| Median | 58.0% | 50.1% |
| Interquartile 25% (IQ1) | 51.5% | 46.7% |
| Interquartile 75% (IQ3) | 61.2% | 57.5% |
| Interquartile Range (IQR) | 9.8% | 10.8% |
| Standard Deviation (Sample) | 8.5% | 12.5% |
| Standard Deviation (Population) | 8.5% | 12.4% |
Similar Demographics by 2 or more Vehicles in Household
Demographics Similar to Salvadorans by 2 or more Vehicles in Household
In terms of 2 or more vehicles in household, the demographic groups most similar to Salvadorans are Cuban (56.3%, a difference of 0.010%), Armenian (56.3%, a difference of 0.030%), Latvian (56.2%, a difference of 0.080%), Immigrants from Cambodia (56.2%, a difference of 0.080%), and Immigrants from Asia (56.3%, a difference of 0.10%).
| Demographics | Rating | Rank | 2 or more Vehicles in Household |
| Bulgarians | 89.7 /100 | #131 | Excellent 56.5% |
| Hungarians | 89.1 /100 | #132 | Excellent 56.5% |
| Comanche | 88.4 /100 | #133 | Excellent 56.5% |
| Immigrants | Azores | 86.6 /100 | #134 | Excellent 56.4% |
| Blackfeet | 86.5 /100 | #135 | Excellent 56.4% |
| Immigrants | Asia | 86.0 /100 | #136 | Excellent 56.3% |
| Cubans | 84.8 /100 | #137 | Excellent 56.3% |
| Salvadorans | 84.7 /100 | #138 | Excellent 56.3% |
| Armenians | 84.3 /100 | #139 | Excellent 56.3% |
| Latvians | 83.6 /100 | #140 | Excellent 56.2% |
| Immigrants | Cambodia | 83.6 /100 | #141 | Excellent 56.2% |
| South Africans | 83.1 /100 | #142 | Excellent 56.2% |
| Seminole | 81.7 /100 | #143 | Excellent 56.2% |
| Immigrants | Syria | 81.4 /100 | #144 | Excellent 56.2% |
| Syrians | 81.2 /100 | #145 | Excellent 56.2% |
Demographics Similar to Bahamians by 2 or more Vehicles in Household
In terms of 2 or more vehicles in household, the demographic groups most similar to Bahamians are Immigrants from Kazakhstan (51.6%, a difference of 0.060%), Immigrants from China (51.5%, a difference of 0.080%), Immigrants from Zaire (51.5%, a difference of 0.12%), Immigrants from Uruguay (51.4%, a difference of 0.28%), and Immigrants from Eastern Europe (51.7%, a difference of 0.37%).
| Demographics | Rating | Rank | 2 or more Vehicles in Household |
| Immigrants | Honduras | 0.2 /100 | #275 | Tragic 51.8% |
| Immigrants | Croatia | 0.2 /100 | #276 | Tragic 51.8% |
| Immigrants | Africa | 0.2 /100 | #277 | Tragic 51.8% |
| Yuman | 0.1 /100 | #278 | Tragic 51.7% |
| Liberians | 0.1 /100 | #279 | Tragic 51.7% |
| Immigrants | Eastern Europe | 0.1 /100 | #280 | Tragic 51.7% |
| Immigrants | Kazakhstan | 0.1 /100 | #281 | Tragic 51.6% |
| Bahamians | 0.1 /100 | #282 | Tragic 51.5% |
| Immigrants | China | 0.1 /100 | #283 | Tragic 51.5% |
| Immigrants | Zaire | 0.1 /100 | #284 | Tragic 51.5% |
| Immigrants | Uruguay | 0.1 /100 | #285 | Tragic 51.4% |
| Immigrants | Liberia | 0.1 /100 | #286 | Tragic 51.3% |
| Immigrants | Serbia | 0.1 /100 | #287 | Tragic 51.3% |
| Okinawans | 0.1 /100 | #288 | Tragic 51.2% |
| Somalis | 0.0 /100 | #289 | Tragic 51.1% |