Immigrants from Ethiopia vs Korean 3 or more Vehicles in Household
COMPARE
Immigrants from Ethiopia
Korean
3 or more Vehicles in Household
3 or more Vehicles in Household Comparison
Immigrants from Ethiopia
Koreans
17.9%
3 OR MORE VEHICLES IN HOUSEHOLD
1.3/ 100
METRIC RATING
253rd/ 347
METRIC RANK
24.1%
3 OR MORE VEHICLES IN HOUSEHOLD
100.0/ 100
METRIC RATING
17th/ 347
METRIC RANK
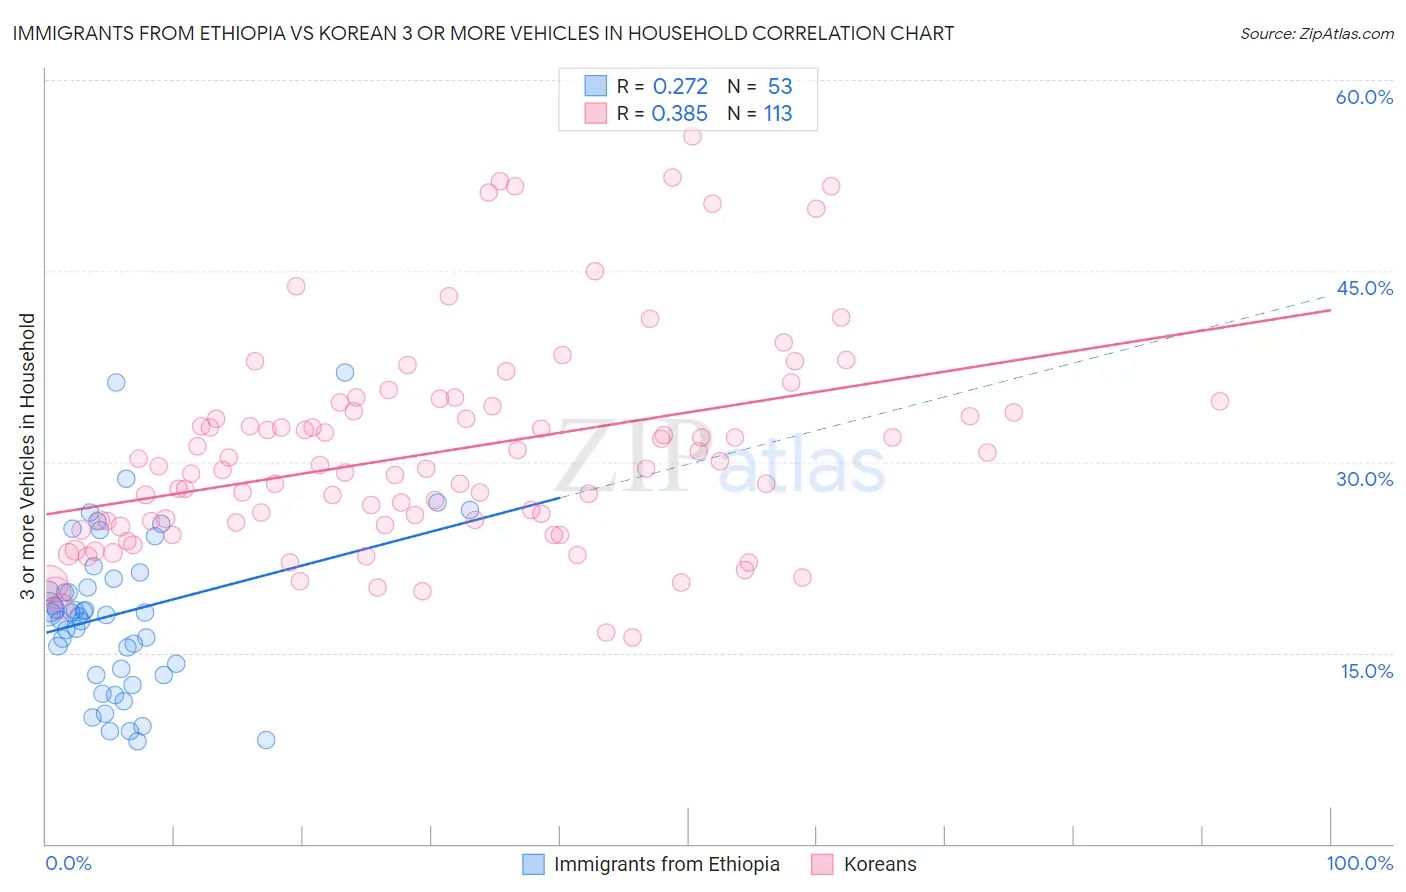
Immigrants from Ethiopia vs Korean 3 or more Vehicles in Household Correlation Chart
The statistical analysis conducted on geographies consisting of 211,428,761 people shows a weak positive correlation between the proportion of Immigrants from Ethiopia and percentage of households with 3 or more vehicles available in the United States with a correlation coefficient (R) of 0.272 and weighted average of 17.9%. Similarly, the statistical analysis conducted on geographies consisting of 510,183,740 people shows a mild positive correlation between the proportion of Koreans and percentage of households with 3 or more vehicles available in the United States with a correlation coefficient (R) of 0.385 and weighted average of 24.1%, a difference of 34.5%.
3 or more Vehicles in Household Correlation Summary
| Measurement | Immigrants from Ethiopia | Korean |
| Minimum | 8.0% | 16.2% |
| Maximum | 37.1% | 55.6% |
| Range | 29.0% | 39.4% |
| Mean | 18.1% | 30.8% |
| Median | 18.1% | 29.4% |
| Interquartile 25% (IQ1) | 13.5% | 25.1% |
| Interquartile 75% (IQ3) | 21.1% | 34.2% |
| Interquartile Range (IQR) | 7.6% | 9.1% |
| Standard Deviation (Sample) | 6.4% | 8.3% |
| Standard Deviation (Population) | 6.3% | 8.2% |
Similar Demographics by 3 or more Vehicles in Household
Demographics Similar to Immigrants from Ethiopia by 3 or more Vehicles in Household
In terms of 3 or more vehicles in household, the demographic groups most similar to Immigrants from Ethiopia are Ethiopian (17.9%, a difference of 0.0%), Immigrants from Turkey (17.9%, a difference of 0.030%), Subsaharan African (17.9%, a difference of 0.19%), Immigrants from Southern Europe (17.9%, a difference of 0.21%), and Immigrants from Eritrea (17.8%, a difference of 0.23%).
| Demographics | Rating | Rank | 3 or more Vehicles in Household |
| Immigrants | Australia | 2.0 /100 | #246 | Tragic 18.1% |
| Carpatho Rusyns | 1.9 /100 | #247 | Tragic 18.0% |
| Immigrants | Eastern Africa | 1.8 /100 | #248 | Tragic 18.0% |
| Immigrants | Saudi Arabia | 1.7 /100 | #249 | Tragic 18.0% |
| Venezuelans | 1.7 /100 | #250 | Tragic 18.0% |
| Alsatians | 1.5 /100 | #251 | Tragic 18.0% |
| Immigrants | Southern Europe | 1.4 /100 | #252 | Tragic 17.9% |
| Immigrants | Ethiopia | 1.3 /100 | #253 | Tragic 17.9% |
| Ethiopians | 1.2 /100 | #254 | Tragic 17.9% |
| Immigrants | Turkey | 1.2 /100 | #255 | Tragic 17.9% |
| Sub-Saharan Africans | 1.1 /100 | #256 | Tragic 17.9% |
| Immigrants | Eritrea | 1.1 /100 | #257 | Tragic 17.8% |
| Sudanese | 1.1 /100 | #258 | Tragic 17.8% |
| Uruguayans | 1.0 /100 | #259 | Tragic 17.8% |
| Ugandans | 0.9 /100 | #260 | Tragic 17.8% |
Demographics Similar to Koreans by 3 or more Vehicles in Household
In terms of 3 or more vehicles in household, the demographic groups most similar to Koreans are Norwegian (23.9%, a difference of 0.79%), Basque (24.3%, a difference of 0.80%), Chinese (23.9%, a difference of 0.82%), Hawaiian (24.3%, a difference of 0.83%), and Paiute (23.8%, a difference of 1.1%).
| Demographics | Rating | Rank | 3 or more Vehicles in Household |
| Nepalese | 100.0 /100 | #10 | Exceptional 24.9% |
| Shoshone | 100.0 /100 | #11 | Exceptional 24.9% |
| Danes | 100.0 /100 | #12 | Exceptional 24.7% |
| Mexicans | 100.0 /100 | #13 | Exceptional 24.7% |
| Immigrants | Mexico | 100.0 /100 | #14 | Exceptional 24.6% |
| Hawaiians | 100.0 /100 | #15 | Exceptional 24.3% |
| Basques | 100.0 /100 | #16 | Exceptional 24.3% |
| Koreans | 100.0 /100 | #17 | Exceptional 24.1% |
| Norwegians | 100.0 /100 | #18 | Exceptional 23.9% |
| Chinese | 100.0 /100 | #19 | Exceptional 23.9% |
| Paiute | 100.0 /100 | #20 | Exceptional 23.8% |
| Immigrants | Vietnam | 100.0 /100 | #21 | Exceptional 23.8% |
| Immigrants | Philippines | 100.0 /100 | #22 | Exceptional 23.8% |
| Scandinavians | 100.0 /100 | #23 | Exceptional 23.6% |
| Sri Lankans | 100.0 /100 | #24 | Exceptional 23.6% |