Belgian vs Korean 3 or more Vehicles in Household
COMPARE
Belgian
Korean
3 or more Vehicles in Household
3 or more Vehicles in Household Comparison
Belgians
Koreans
21.2%
3 OR MORE VEHICLES IN HOUSEHOLD
98.9/ 100
METRIC RATING
91st/ 347
METRIC RANK
24.1%
3 OR MORE VEHICLES IN HOUSEHOLD
100.0/ 100
METRIC RATING
17th/ 347
METRIC RANK
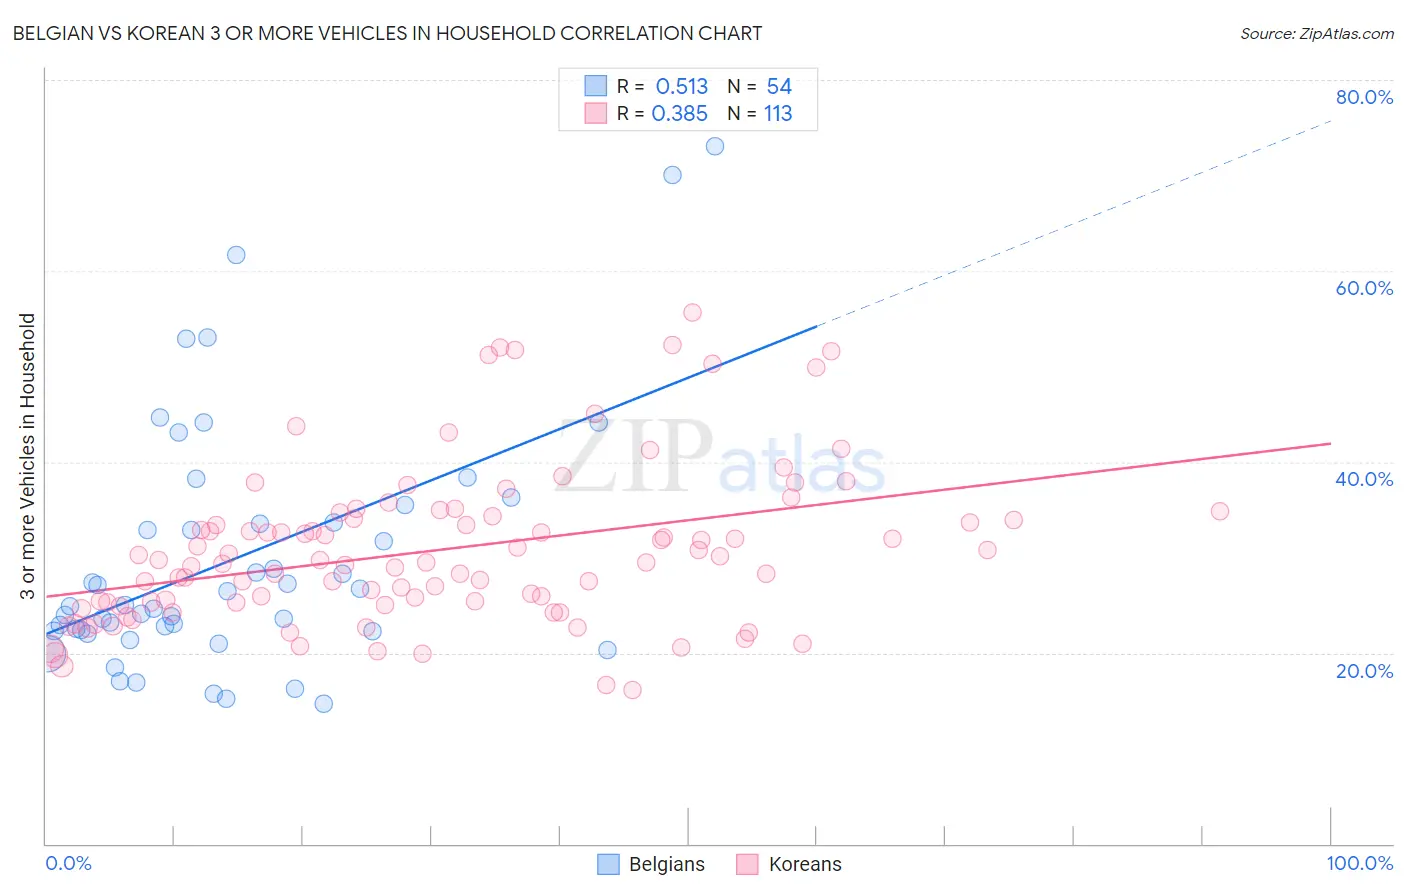
Belgian vs Korean 3 or more Vehicles in Household Correlation Chart
The statistical analysis conducted on geographies consisting of 355,741,877 people shows a substantial positive correlation between the proportion of Belgians and percentage of households with 3 or more vehicles available in the United States with a correlation coefficient (R) of 0.513 and weighted average of 21.2%. Similarly, the statistical analysis conducted on geographies consisting of 510,183,740 people shows a mild positive correlation between the proportion of Koreans and percentage of households with 3 or more vehicles available in the United States with a correlation coefficient (R) of 0.385 and weighted average of 24.1%, a difference of 13.7%.
3 or more Vehicles in Household Correlation Summary
| Measurement | Belgian | Korean |
| Minimum | 14.7% | 16.2% |
| Maximum | 73.1% | 55.6% |
| Range | 58.4% | 39.4% |
| Mean | 29.9% | 30.8% |
| Median | 25.0% | 29.4% |
| Interquartile 25% (IQ1) | 22.3% | 25.1% |
| Interquartile 75% (IQ3) | 33.6% | 34.2% |
| Interquartile Range (IQR) | 11.3% | 9.1% |
| Standard Deviation (Sample) | 13.1% | 8.3% |
| Standard Deviation (Population) | 12.9% | 8.2% |
Similar Demographics by 3 or more Vehicles in Household
Demographics Similar to Belgians by 3 or more Vehicles in Household
In terms of 3 or more vehicles in household, the demographic groups most similar to Belgians are Apache (21.2%, a difference of 0.080%), Immigrants from Indonesia (21.1%, a difference of 0.28%), Immigrants from Afghanistan (21.2%, a difference of 0.33%), Immigrants from Cambodia (21.1%, a difference of 0.51%), and Marshallese (21.3%, a difference of 0.55%).
| Demographics | Rating | Rank | 3 or more Vehicles in Household |
| Icelanders | 99.6 /100 | #84 | Exceptional 21.5% |
| Laotians | 99.6 /100 | #85 | Exceptional 21.5% |
| Delaware | 99.6 /100 | #86 | Exceptional 21.5% |
| Immigrants | Azores | 99.5 /100 | #87 | Exceptional 21.5% |
| French | 99.4 /100 | #88 | Exceptional 21.4% |
| Marshallese | 99.2 /100 | #89 | Exceptional 21.3% |
| Immigrants | Afghanistan | 99.1 /100 | #90 | Exceptional 21.2% |
| Belgians | 98.9 /100 | #91 | Exceptional 21.2% |
| Apache | 98.9 /100 | #92 | Exceptional 21.2% |
| Immigrants | Indonesia | 98.8 /100 | #93 | Exceptional 21.1% |
| Immigrants | Cambodia | 98.6 /100 | #94 | Exceptional 21.1% |
| Pakistanis | 98.5 /100 | #95 | Exceptional 21.0% |
| Cree | 98.4 /100 | #96 | Exceptional 21.0% |
| Canadians | 98.3 /100 | #97 | Exceptional 21.0% |
| Hmong | 98.2 /100 | #98 | Exceptional 21.0% |
Demographics Similar to Koreans by 3 or more Vehicles in Household
In terms of 3 or more vehicles in household, the demographic groups most similar to Koreans are Norwegian (23.9%, a difference of 0.79%), Basque (24.3%, a difference of 0.80%), Chinese (23.9%, a difference of 0.82%), Hawaiian (24.3%, a difference of 0.83%), and Paiute (23.8%, a difference of 1.1%).
| Demographics | Rating | Rank | 3 or more Vehicles in Household |
| Nepalese | 100.0 /100 | #10 | Exceptional 24.9% |
| Shoshone | 100.0 /100 | #11 | Exceptional 24.9% |
| Danes | 100.0 /100 | #12 | Exceptional 24.7% |
| Mexicans | 100.0 /100 | #13 | Exceptional 24.7% |
| Immigrants | Mexico | 100.0 /100 | #14 | Exceptional 24.6% |
| Hawaiians | 100.0 /100 | #15 | Exceptional 24.3% |
| Basques | 100.0 /100 | #16 | Exceptional 24.3% |
| Koreans | 100.0 /100 | #17 | Exceptional 24.1% |
| Norwegians | 100.0 /100 | #18 | Exceptional 23.9% |
| Chinese | 100.0 /100 | #19 | Exceptional 23.9% |
| Paiute | 100.0 /100 | #20 | Exceptional 23.8% |
| Immigrants | Vietnam | 100.0 /100 | #21 | Exceptional 23.8% |
| Immigrants | Philippines | 100.0 /100 | #22 | Exceptional 23.8% |
| Scandinavians | 100.0 /100 | #23 | Exceptional 23.6% |
| Sri Lankans | 100.0 /100 | #24 | Exceptional 23.6% |