Immigrants from Bosnia and Herzegovina vs Korean 3 or more Vehicles in Household
COMPARE
Immigrants from Bosnia and Herzegovina
Korean
3 or more Vehicles in Household
3 or more Vehicles in Household Comparison
Immigrants from Bosnia and Herzegovina
Koreans
17.5%
3 OR MORE VEHICLES IN HOUSEHOLD
0.5/ 100
METRIC RATING
274th/ 347
METRIC RANK
24.1%
3 OR MORE VEHICLES IN HOUSEHOLD
100.0/ 100
METRIC RATING
17th/ 347
METRIC RANK
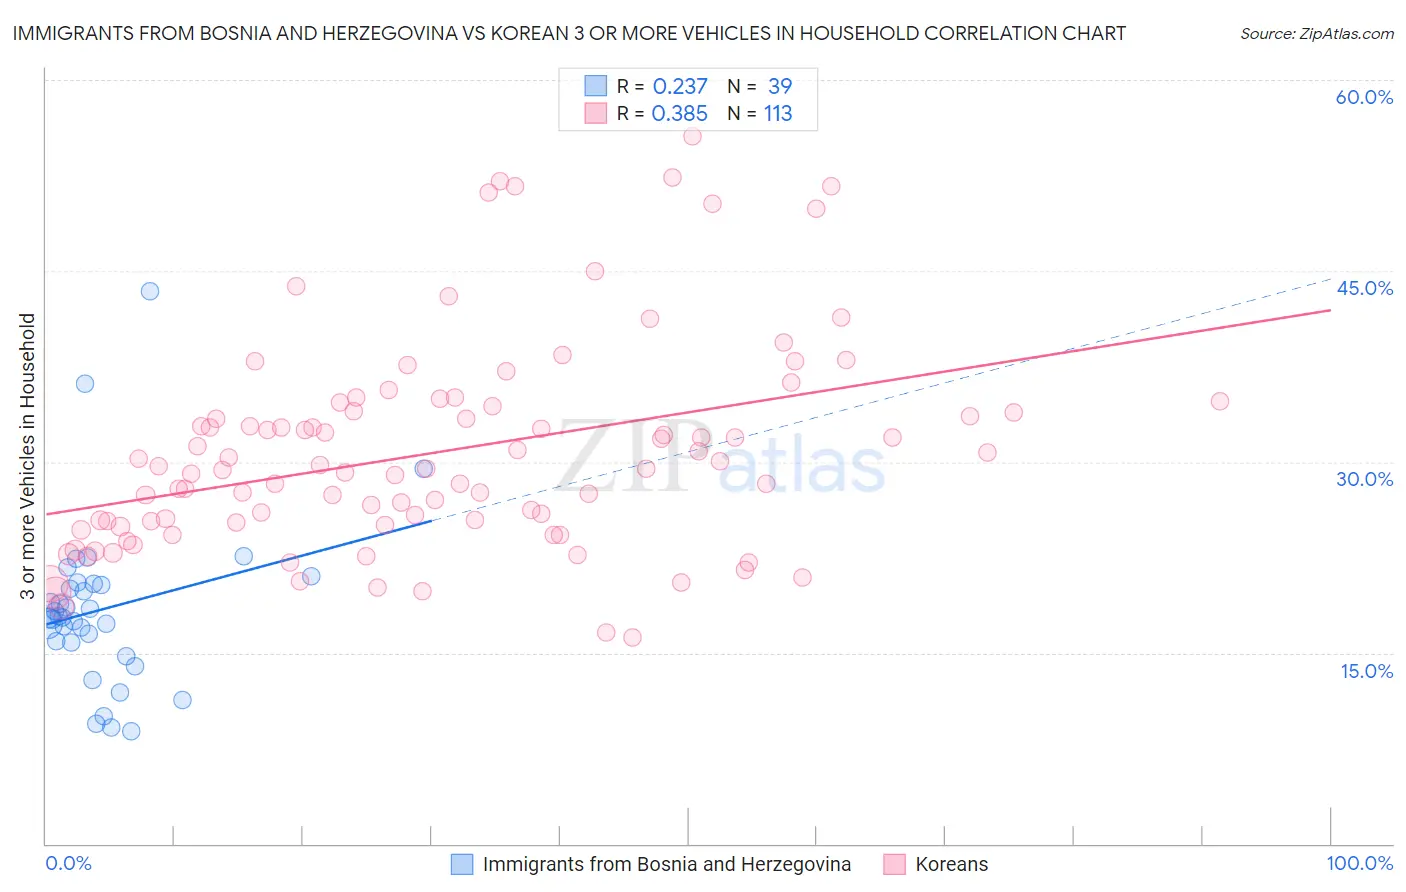
Immigrants from Bosnia and Herzegovina vs Korean 3 or more Vehicles in Household Correlation Chart
The statistical analysis conducted on geographies consisting of 156,800,746 people shows a weak positive correlation between the proportion of Immigrants from Bosnia and Herzegovina and percentage of households with 3 or more vehicles available in the United States with a correlation coefficient (R) of 0.237 and weighted average of 17.5%. Similarly, the statistical analysis conducted on geographies consisting of 510,183,740 people shows a mild positive correlation between the proportion of Koreans and percentage of households with 3 or more vehicles available in the United States with a correlation coefficient (R) of 0.385 and weighted average of 24.1%, a difference of 37.3%.
3 or more Vehicles in Household Correlation Summary
| Measurement | Immigrants from Bosnia and Herzegovina | Korean |
| Minimum | 8.8% | 16.2% |
| Maximum | 43.4% | 55.6% |
| Range | 34.6% | 39.4% |
| Mean | 18.5% | 30.8% |
| Median | 17.8% | 29.4% |
| Interquartile 25% (IQ1) | 15.8% | 25.1% |
| Interquartile 75% (IQ3) | 20.4% | 34.2% |
| Interquartile Range (IQR) | 4.7% | 9.1% |
| Standard Deviation (Sample) | 6.6% | 8.3% |
| Standard Deviation (Population) | 6.5% | 8.2% |
Similar Demographics by 3 or more Vehicles in Household
Demographics Similar to Immigrants from Bosnia and Herzegovina by 3 or more Vehicles in Household
In terms of 3 or more vehicles in household, the demographic groups most similar to Immigrants from Bosnia and Herzegovina are Immigrants from Sudan (17.6%, a difference of 0.15%), Immigrants from Africa (17.6%, a difference of 0.18%), Immigrants from Ukraine (17.5%, a difference of 0.29%), Okinawan (17.4%, a difference of 0.45%), and Brazilian (17.4%, a difference of 0.59%).
| Demographics | Rating | Rank | 3 or more Vehicles in Household |
| Immigrants | Venezuela | 0.8 /100 | #267 | Tragic 17.7% |
| Immigrants | Bulgaria | 0.8 /100 | #268 | Tragic 17.7% |
| Immigrants | France | 0.6 /100 | #269 | Tragic 17.6% |
| Immigrants | Nepal | 0.6 /100 | #270 | Tragic 17.6% |
| South Americans | 0.6 /100 | #271 | Tragic 17.6% |
| Immigrants | Africa | 0.5 /100 | #272 | Tragic 17.6% |
| Immigrants | Sudan | 0.5 /100 | #273 | Tragic 17.6% |
| Immigrants | Bosnia and Herzegovina | 0.5 /100 | #274 | Tragic 17.5% |
| Immigrants | Ukraine | 0.4 /100 | #275 | Tragic 17.5% |
| Okinawans | 0.4 /100 | #276 | Tragic 17.4% |
| Brazilians | 0.4 /100 | #277 | Tragic 17.4% |
| Immigrants | Bahamas | 0.3 /100 | #278 | Tragic 17.4% |
| Immigrants | Kazakhstan | 0.3 /100 | #279 | Tragic 17.4% |
| Immigrants | Eastern Europe | 0.3 /100 | #280 | Tragic 17.4% |
| Immigrants | Latvia | 0.3 /100 | #281 | Tragic 17.4% |
Demographics Similar to Koreans by 3 or more Vehicles in Household
In terms of 3 or more vehicles in household, the demographic groups most similar to Koreans are Norwegian (23.9%, a difference of 0.79%), Basque (24.3%, a difference of 0.80%), Chinese (23.9%, a difference of 0.82%), Hawaiian (24.3%, a difference of 0.83%), and Paiute (23.8%, a difference of 1.1%).
| Demographics | Rating | Rank | 3 or more Vehicles in Household |
| Nepalese | 100.0 /100 | #10 | Exceptional 24.9% |
| Shoshone | 100.0 /100 | #11 | Exceptional 24.9% |
| Danes | 100.0 /100 | #12 | Exceptional 24.7% |
| Mexicans | 100.0 /100 | #13 | Exceptional 24.7% |
| Immigrants | Mexico | 100.0 /100 | #14 | Exceptional 24.6% |
| Hawaiians | 100.0 /100 | #15 | Exceptional 24.3% |
| Basques | 100.0 /100 | #16 | Exceptional 24.3% |
| Koreans | 100.0 /100 | #17 | Exceptional 24.1% |
| Norwegians | 100.0 /100 | #18 | Exceptional 23.9% |
| Chinese | 100.0 /100 | #19 | Exceptional 23.9% |
| Paiute | 100.0 /100 | #20 | Exceptional 23.8% |
| Immigrants | Vietnam | 100.0 /100 | #21 | Exceptional 23.8% |
| Immigrants | Philippines | 100.0 /100 | #22 | Exceptional 23.8% |
| Scandinavians | 100.0 /100 | #23 | Exceptional 23.6% |
| Sri Lankans | 100.0 /100 | #24 | Exceptional 23.6% |