Immigrants from Ethiopia vs Immigrants from Czechoslovakia 3 or more Vehicles in Household
COMPARE
Immigrants from Ethiopia
Immigrants from Czechoslovakia
3 or more Vehicles in Household
3 or more Vehicles in Household Comparison
Immigrants from Ethiopia
Immigrants from Czechoslovakia
17.9%
3 OR MORE VEHICLES IN HOUSEHOLD
1.3/ 100
METRIC RATING
253rd/ 347
METRIC RANK
18.5%
3 OR MORE VEHICLES IN HOUSEHOLD
5.9/ 100
METRIC RATING
223rd/ 347
METRIC RANK
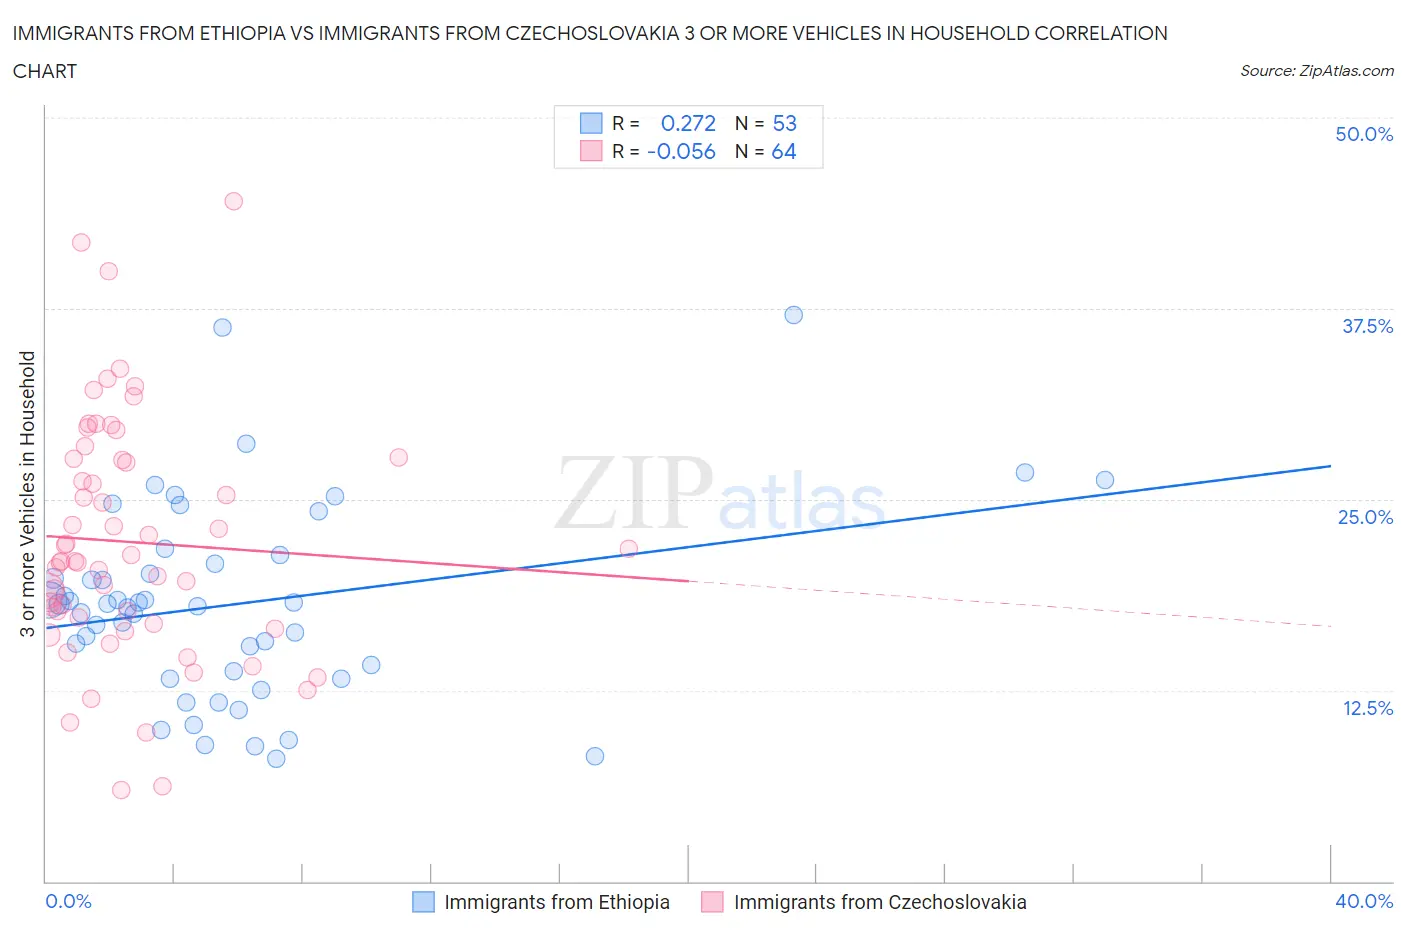
Immigrants from Ethiopia vs Immigrants from Czechoslovakia 3 or more Vehicles in Household Correlation Chart
The statistical analysis conducted on geographies consisting of 211,428,761 people shows a weak positive correlation between the proportion of Immigrants from Ethiopia and percentage of households with 3 or more vehicles available in the United States with a correlation coefficient (R) of 0.272 and weighted average of 17.9%. Similarly, the statistical analysis conducted on geographies consisting of 195,424,103 people shows a slight negative correlation between the proportion of Immigrants from Czechoslovakia and percentage of households with 3 or more vehicles available in the United States with a correlation coefficient (R) of -0.056 and weighted average of 18.5%, a difference of 3.3%.
3 or more Vehicles in Household Correlation Summary
| Measurement | Immigrants from Ethiopia | Immigrants from Czechoslovakia |
| Minimum | 8.0% | 6.0% |
| Maximum | 37.1% | 44.5% |
| Range | 29.0% | 38.5% |
| Mean | 18.1% | 22.2% |
| Median | 18.1% | 21.0% |
| Interquartile 25% (IQ1) | 13.5% | 17.1% |
| Interquartile 75% (IQ3) | 21.1% | 27.6% |
| Interquartile Range (IQR) | 7.6% | 10.6% |
| Standard Deviation (Sample) | 6.4% | 7.9% |
| Standard Deviation (Population) | 6.3% | 7.8% |
Similar Demographics by 3 or more Vehicles in Household
Demographics Similar to Immigrants from Ethiopia by 3 or more Vehicles in Household
In terms of 3 or more vehicles in household, the demographic groups most similar to Immigrants from Ethiopia are Ethiopian (17.9%, a difference of 0.0%), Immigrants from Turkey (17.9%, a difference of 0.030%), Subsaharan African (17.9%, a difference of 0.19%), Immigrants from Southern Europe (17.9%, a difference of 0.21%), and Immigrants from Eritrea (17.8%, a difference of 0.23%).
| Demographics | Rating | Rank | 3 or more Vehicles in Household |
| Immigrants | Australia | 2.0 /100 | #246 | Tragic 18.1% |
| Carpatho Rusyns | 1.9 /100 | #247 | Tragic 18.0% |
| Immigrants | Eastern Africa | 1.8 /100 | #248 | Tragic 18.0% |
| Immigrants | Saudi Arabia | 1.7 /100 | #249 | Tragic 18.0% |
| Venezuelans | 1.7 /100 | #250 | Tragic 18.0% |
| Alsatians | 1.5 /100 | #251 | Tragic 18.0% |
| Immigrants | Southern Europe | 1.4 /100 | #252 | Tragic 17.9% |
| Immigrants | Ethiopia | 1.3 /100 | #253 | Tragic 17.9% |
| Ethiopians | 1.2 /100 | #254 | Tragic 17.9% |
| Immigrants | Turkey | 1.2 /100 | #255 | Tragic 17.9% |
| Sub-Saharan Africans | 1.1 /100 | #256 | Tragic 17.9% |
| Immigrants | Eritrea | 1.1 /100 | #257 | Tragic 17.8% |
| Sudanese | 1.1 /100 | #258 | Tragic 17.8% |
| Uruguayans | 1.0 /100 | #259 | Tragic 17.8% |
| Ugandans | 0.9 /100 | #260 | Tragic 17.8% |
Demographics Similar to Immigrants from Czechoslovakia by 3 or more Vehicles in Household
In terms of 3 or more vehicles in household, the demographic groups most similar to Immigrants from Czechoslovakia are Immigrants from Argentina (18.5%, a difference of 0.11%), Immigrants from Lithuania (18.5%, a difference of 0.11%), Immigrants from Hungary (18.5%, a difference of 0.15%), Immigrants from Singapore (18.4%, a difference of 0.17%), and Turkish (18.4%, a difference of 0.20%).
| Demographics | Rating | Rank | 3 or more Vehicles in Household |
| Immigrants | Nigeria | 10.3 /100 | #216 | Poor 18.7% |
| Immigrants | Italy | 10.2 /100 | #217 | Poor 18.7% |
| Immigrants | Portugal | 8.9 /100 | #218 | Tragic 18.6% |
| Immigrants | Armenia | 8.6 /100 | #219 | Tragic 18.6% |
| Nigerians | 7.9 /100 | #220 | Tragic 18.6% |
| Immigrants | Poland | 7.5 /100 | #221 | Tragic 18.6% |
| Belizeans | 7.3 /100 | #222 | Tragic 18.6% |
| Immigrants | Czechoslovakia | 5.9 /100 | #223 | Tragic 18.5% |
| Immigrants | Argentina | 5.6 /100 | #224 | Tragic 18.5% |
| Immigrants | Lithuania | 5.6 /100 | #225 | Tragic 18.5% |
| Immigrants | Hungary | 5.5 /100 | #226 | Tragic 18.5% |
| Immigrants | Singapore | 5.4 /100 | #227 | Tragic 18.4% |
| Turks | 5.4 /100 | #228 | Tragic 18.4% |
| Immigrants | Switzerland | 5.0 /100 | #229 | Tragic 18.4% |
| Immigrants | Western Asia | 4.8 /100 | #230 | Tragic 18.4% |