Filipino vs Immigrants from Hungary 3 or more Vehicles in Household
COMPARE
Filipino
Immigrants from Hungary
3 or more Vehicles in Household
3 or more Vehicles in Household Comparison
Filipinos
Immigrants from Hungary
20.8%
3 OR MORE VEHICLES IN HOUSEHOLD
97.0/ 100
METRIC RATING
109th/ 347
METRIC RANK
18.5%
3 OR MORE VEHICLES IN HOUSEHOLD
5.5/ 100
METRIC RATING
226th/ 347
METRIC RANK
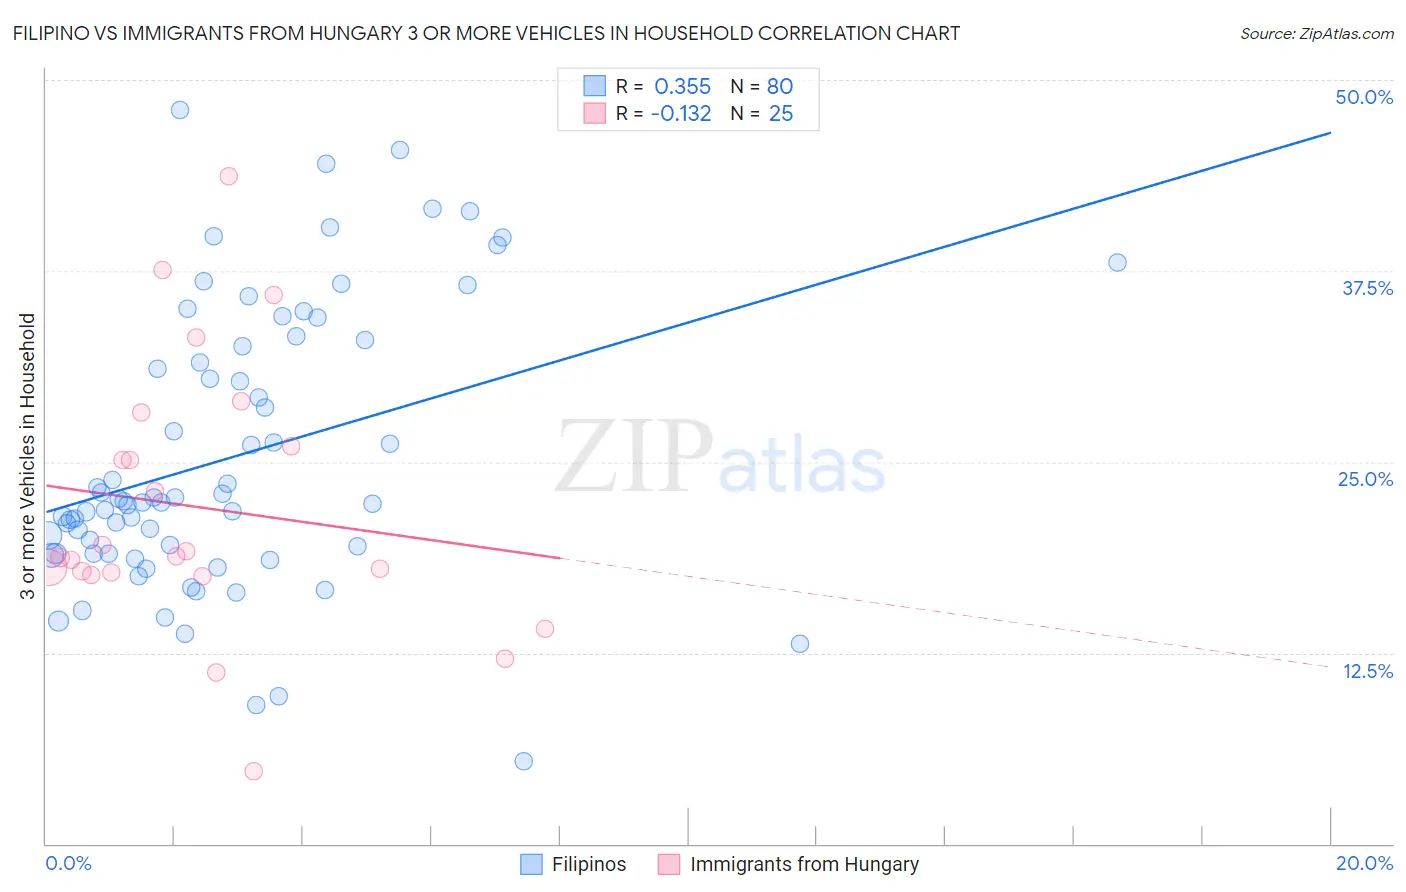
Filipino vs Immigrants from Hungary 3 or more Vehicles in Household Correlation Chart
The statistical analysis conducted on geographies consisting of 254,051,134 people shows a mild positive correlation between the proportion of Filipinos and percentage of households with 3 or more vehicles available in the United States with a correlation coefficient (R) of 0.355 and weighted average of 20.8%. Similarly, the statistical analysis conducted on geographies consisting of 195,641,507 people shows a poor negative correlation between the proportion of Immigrants from Hungary and percentage of households with 3 or more vehicles available in the United States with a correlation coefficient (R) of -0.132 and weighted average of 18.5%, a difference of 12.6%.
3 or more Vehicles in Household Correlation Summary
| Measurement | Filipino | Immigrants from Hungary |
| Minimum | 5.4% | 4.8% |
| Maximum | 48.0% | 43.7% |
| Range | 42.6% | 39.0% |
| Mean | 25.3% | 22.0% |
| Median | 22.4% | 18.9% |
| Interquartile 25% (IQ1) | 19.0% | 17.7% |
| Interquartile 75% (IQ3) | 32.8% | 27.1% |
| Interquartile Range (IQR) | 13.8% | 9.4% |
| Standard Deviation (Sample) | 9.2% | 8.8% |
| Standard Deviation (Population) | 9.1% | 8.7% |
Similar Demographics by 3 or more Vehicles in Household
Demographics Similar to Filipinos by 3 or more Vehicles in Household
In terms of 3 or more vehicles in household, the demographic groups most similar to Filipinos are Immigrants from Scotland (20.8%, a difference of 0.060%), Asian (20.8%, a difference of 0.14%), Immigrants from Micronesia (20.7%, a difference of 0.17%), Immigrants from Germany (20.8%, a difference of 0.21%), and Bolivian (20.8%, a difference of 0.25%).
| Demographics | Rating | Rank | 3 or more Vehicles in Household |
| Seminole | 97.8 /100 | #102 | Exceptional 20.9% |
| Dutch West Indians | 97.8 /100 | #103 | Exceptional 20.9% |
| Luxembourgers | 97.7 /100 | #104 | Exceptional 20.9% |
| Austrians | 97.5 /100 | #105 | Exceptional 20.9% |
| Bolivians | 97.4 /100 | #106 | Exceptional 20.8% |
| Immigrants | Germany | 97.4 /100 | #107 | Exceptional 20.8% |
| Immigrants | Scotland | 97.1 /100 | #108 | Exceptional 20.8% |
| Filipinos | 97.0 /100 | #109 | Exceptional 20.8% |
| Asians | 96.8 /100 | #110 | Exceptional 20.8% |
| Immigrants | Micronesia | 96.7 /100 | #111 | Exceptional 20.7% |
| Nicaraguans | 96.2 /100 | #112 | Exceptional 20.7% |
| Immigrants | England | 96.2 /100 | #113 | Exceptional 20.7% |
| Burmese | 95.8 /100 | #114 | Exceptional 20.6% |
| French Canadians | 95.0 /100 | #115 | Exceptional 20.6% |
| Italians | 94.9 /100 | #116 | Exceptional 20.6% |
Demographics Similar to Immigrants from Hungary by 3 or more Vehicles in Household
In terms of 3 or more vehicles in household, the demographic groups most similar to Immigrants from Hungary are Immigrants from Lithuania (18.5%, a difference of 0.030%), Immigrants from Singapore (18.4%, a difference of 0.030%), Immigrants from Argentina (18.5%, a difference of 0.040%), Turkish (18.4%, a difference of 0.050%), and Immigrants from Czechoslovakia (18.5%, a difference of 0.15%).
| Demographics | Rating | Rank | 3 or more Vehicles in Household |
| Immigrants | Armenia | 8.6 /100 | #219 | Tragic 18.6% |
| Nigerians | 7.9 /100 | #220 | Tragic 18.6% |
| Immigrants | Poland | 7.5 /100 | #221 | Tragic 18.6% |
| Belizeans | 7.3 /100 | #222 | Tragic 18.6% |
| Immigrants | Czechoslovakia | 5.9 /100 | #223 | Tragic 18.5% |
| Immigrants | Argentina | 5.6 /100 | #224 | Tragic 18.5% |
| Immigrants | Lithuania | 5.6 /100 | #225 | Tragic 18.5% |
| Immigrants | Hungary | 5.5 /100 | #226 | Tragic 18.5% |
| Immigrants | Singapore | 5.4 /100 | #227 | Tragic 18.4% |
| Turks | 5.4 /100 | #228 | Tragic 18.4% |
| Immigrants | Switzerland | 5.0 /100 | #229 | Tragic 18.4% |
| Immigrants | Western Asia | 4.8 /100 | #230 | Tragic 18.4% |
| Immigrants | Belgium | 4.8 /100 | #231 | Tragic 18.4% |
| Immigrants | Uganda | 4.6 /100 | #232 | Tragic 18.4% |
| Hondurans | 4.6 /100 | #233 | Tragic 18.4% |